

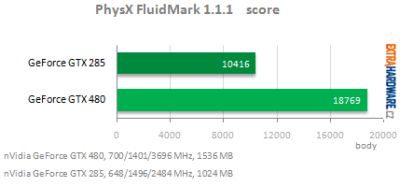
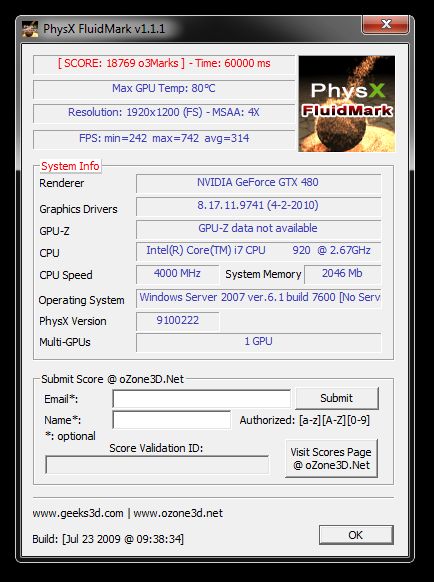
FluidMark is quick way to have a good overview of a graphics card PhysX performance in the domain of fluid simulation. The guys at extrahardware.cz have used FluidMark 1.1.1 for benchmarking a GeForce GTX 480:
- GeForce GTX 480: 18769 points
- GeForce GTX 285: 10416 points
- GeForce GT 240 (3D) + GTS 250 (PhysX): 3500 points
- GeForce GT 240: 1970 points
For this test, FluidMark settings are: 1920×1200, 4X MSAA, fullscreen and 60 seconds. The two last scores are with my dev system (GeForce GT 240 + GeForce GTS 250). The GTX 480 is 10 times faster than a GT 240…
I got a score of 2048 on my 8800GT at 1920X1080 noaa
1920×1080 8xaa 60 secs HD5770 render, 9500GT PhysX = 2114
Hehe… we are far from a GTX480 😀
GTX 470 scores would be interesting…
should have one arriving in the next couple of days
My GTX 470 score – stock i7 930
14,726 = 1600×1200, 4X MSAA, fullscreen
17,396 = 1600×1200, NO MSAA, fullscreen
16,908 = 1280×1040, 4X MSAA, fullscreen
17,908 = 1280×1040, NO MSAA, fullscreen
1920×1080 not possible 🙁 I’m guessing in the 13k range considering how everything scales
My GTX 470 score – stock i7 930 Overlclocked 3,360 using Gigabyte Quicktune
15,268 1600×1200, 4X MSAA, fullscreen
Pretty small overclock yields over 500 more points.
I’m guessing that 16k would be pretty easy with higher OC and tweaks.
Now if games could only put all those cores work like Physx does
interesting…
got the gtx470 today..
scored 7849 on fluidmark
(1280×1024 fullscreen no msaa)
(Q8200@2.33Ghz/4gb ddr2@667/ECS P45T-A)
i guess i need a new mobo…its only running 8x PCI-X as im still using the 3870 as a secondary card 🙁
ill try again later with the 2nd card removed..
my Asus engtx 480 only scorde 324.
why?