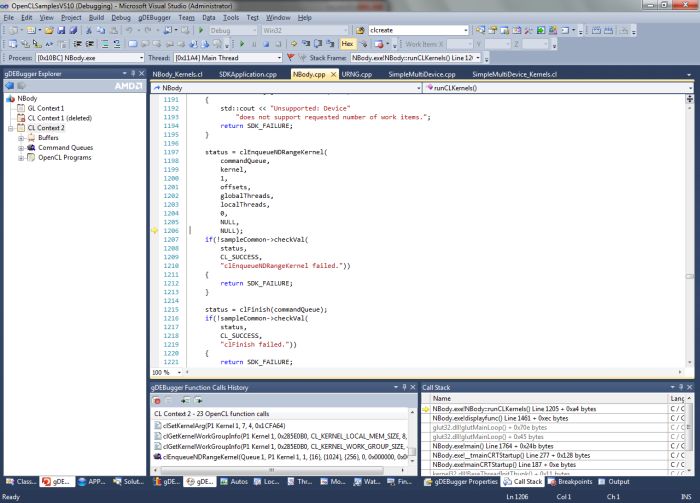
AMD gDEBugger is an advanced OpenGL and OpenCL debugger, profiler and memory analyzer. Actually AMD gDEBugger is based on the well known gDEBugger by Graphic Remedy. This new debugger is a plugin for Visual Studio and supports all capabilities of the original gDEBugger as well as new features.
gDEBugger takes the mystery out of debugging OpenCL and OpenGL, allowing developers to peer into computer and graphic memory objects such as OpenCL images to view their contents as they change from write, copy, and kernel operations. Allocated OpenCL and OpenGL objects are monitored to allow detecting memory leaks and the scenarios that caused the leaking objects to be created, API function call logs can be viewed and saved and unrecommended and deprecated functions and behaviors are marked, with best-practice alternatives offered.
AMD gDEBugger download should be available shortly.
More information on the official homepage: AMD gDEBugger @ AMD.

Ahhh… what about linux support or the old non-visual studio version?
@Leith: The site only states this :
“System Requirements
Microsoft® Windows 7®, Windows Vista® (32-bit and 64-bit supported)
Microsoft® Visual Studio® 2010”
=/
I tghink it would be much better an standalone app so it can run in linux and MacOSX. VS is Windoze.
This is not gonna kick off without the old cross platform GUI packaged as well.
AMD!!! Bring back Linux support! You meanies!