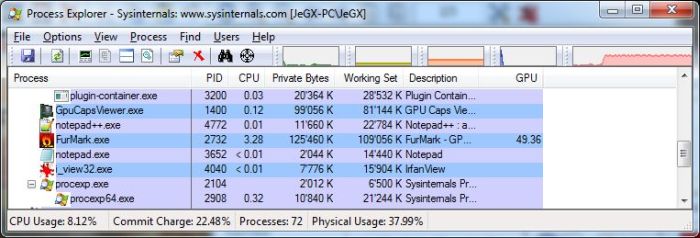
Process Explorer, the popular tool for inspecting and controlling processes and threads under Windows, comes in a new version with GPU support.
You can download Process Explorer v15.0 from this page.
Process Explorer adds the usage of the GPU core and the GPU memory:
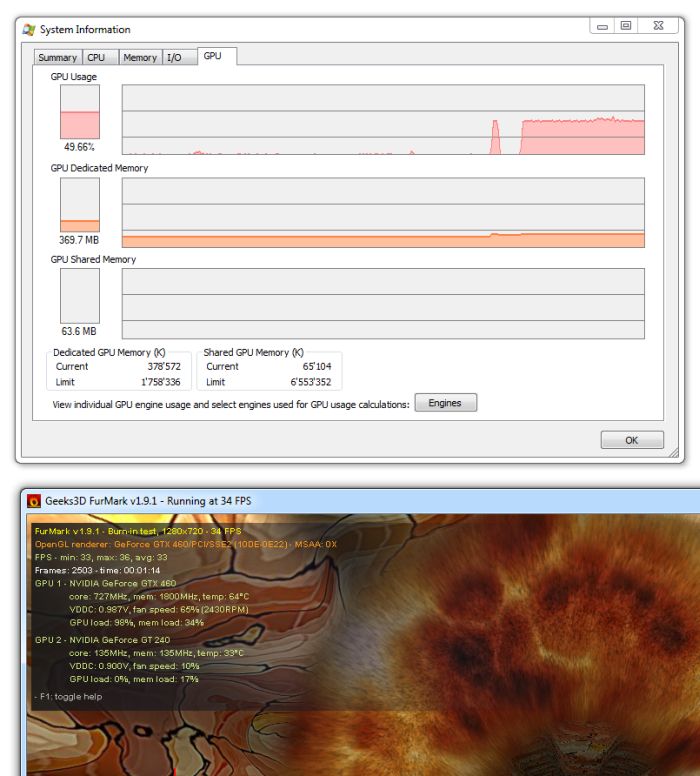
As you can see on this screeshot, the GPU usage is not 100% under FurMark 1.9.1 but it’s around 50%. Why? Because Process Explorer does the same thing than for CPUs: by default, it displays the GPU usage of all GPUs in the system. On my current system, I have a GeForce GTX 460 and a GeForce GT 240. The GTX 460 is the primary graphics card and I ran FurMark in windowed mode leading to a 100% GPU usage for the GTX 460 and 0% GPU usage for the GT 240. The total GPU usage is (100+0)/2 = 50%.
You can also monitor the GPU usage of each GPU by clicking on the Engines button:
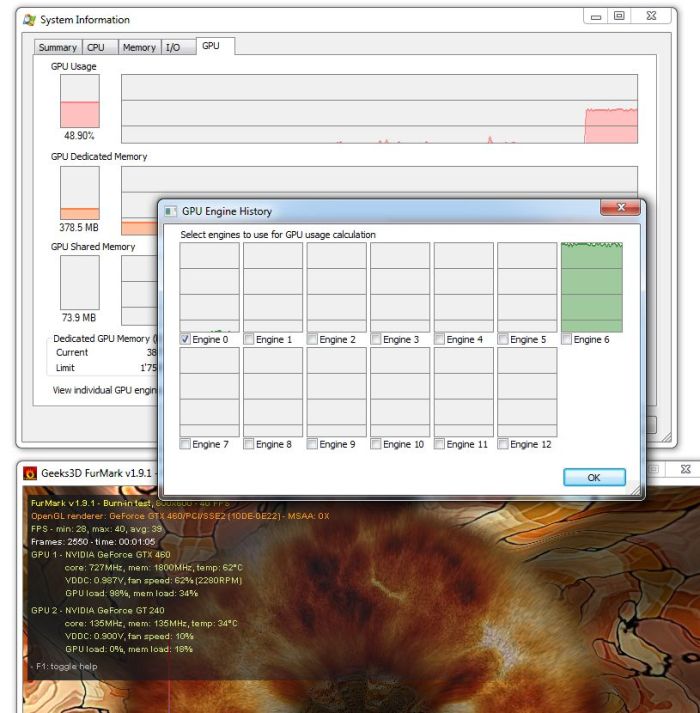
Process Explorer 15.0, GTX 460 + GT 240
Here is the monitoring for a single GTX 580:
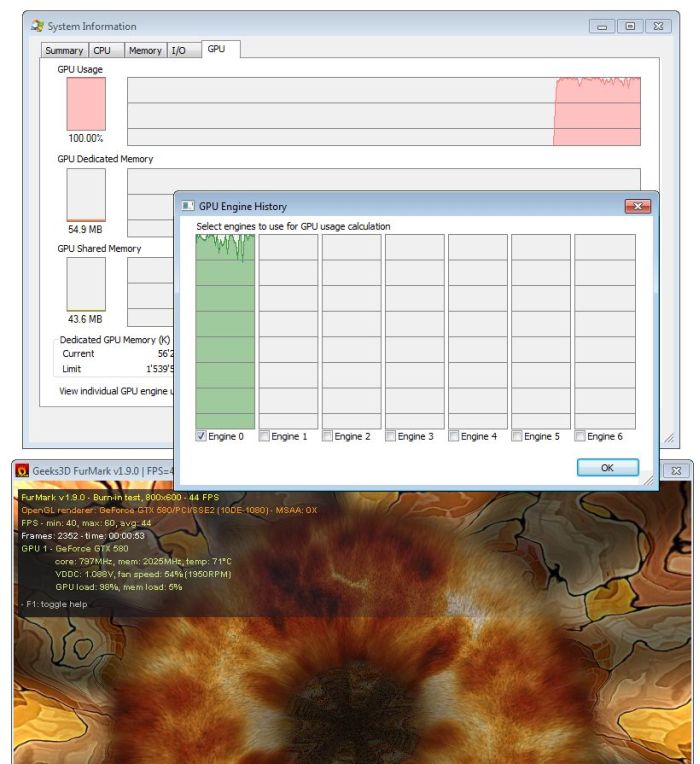
Process Explorer 15.0, GTX 580
As you can see, it seems that Process Explorer adds a group of 7 individual engine graphs for each GPU in the system. Don’t know why…
On a system with a single GPU, the monitor display a 100% GPU usage when FurMark is running, while on a multi-GPU system, I didn’t manage to read the GPU usage of the GPU running FurMark: only the usage of all GPUs was displayed.
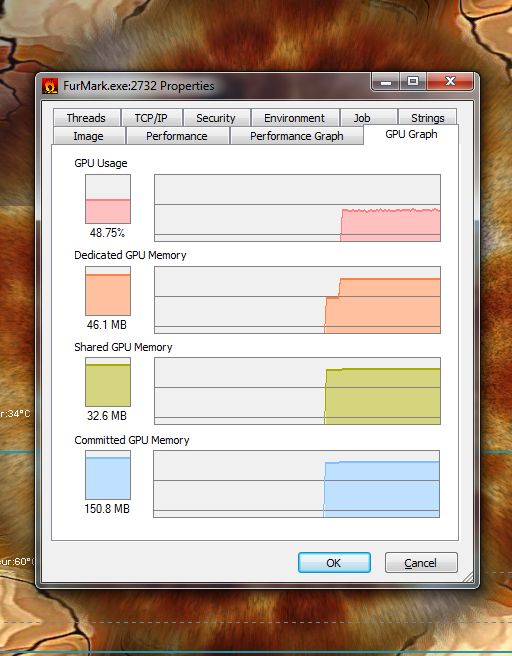
You can access to GPU monitoring also in the properties box of each process:
Update (2011.07.20)
GPU engines for a Radeon HD 4870 (source: in the comments):
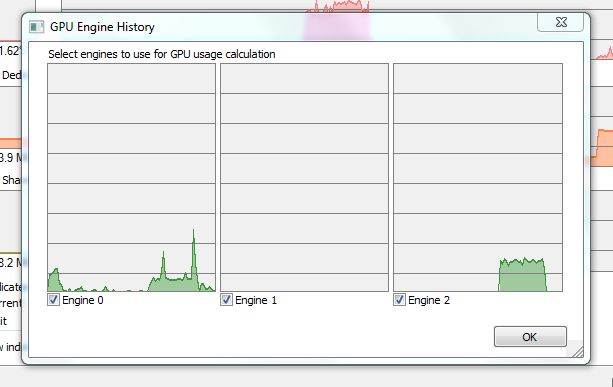
OMG, looks like first tool that shows memory usage and real gpu usage on AMD cards.
On HD4870 thare are only 3 Engines.
Standard 3D apps use Engine 0, but when I played HD movie using MPC-HC with DXVA, engine 2 was used too.
http://img684.imageshack.us/img684/7205/procexphd4870.png
@Virus: thanks for the screeny.
Hey JeGX, any idea on what Windows Vista API the Sysinternals guy used?
I wonder why no other GPU tools have done this before.
It is fascinating to see where your GPU memory goes. Currently using 400MB out of 1GB. Most of that goes to DWM (Windows Aero) and IE9 (with about 25 tabs open).
I ran FEAR 3 and it went to 880MB with 2xAA and 966MB with 4xAA.
Shows that you should close any background programs if you want to get good AA performance from a game.
awesome..ive been looking for a program that can show processes using the GPU for a while..
this looks perfect 🙂
cant work out these “engines”
with 2 GPUs (GTX470+9400GT)
Engine 0 never goes above 10%
Engine 6 shows usage when a 3D app is running..
Engine 12 shows usage when engine 6 maxes out..
all other engines show 0..
strange thing is if i disable the 9400GT..i have only 6 ‘engines’, Engine 0 will max out when running 3D..and engine 6 will join in once engine 0 maxes out..and again..all other engines show 0
if i run openCL on the 2nd card, and run the 3d on the firt..then engine 0 maxes out..and so does engine 5!..but engine 6 is at 0%..if i move the window across to another monitor, i can see the GPU usage for that gpu (the 9400GT) raise from 97% to 98%..but the engines remain changed
i was thinking it maybe an engine for textures, and engine for physx, one for opencl..but that doesnt seem to be the case..
the only thing i can come up with is when you have 2 GPUs then the engines should be read like
GPU1= engine 2,4,6,8,10,12
GPU2= engine 1,3,5,7,9,11
and its looking like engine 0 is the DWM
but dont quote me on that! :p
Check out newest Process Hacker 2 tool. It’s now quite comparable to Processexplorer with even more goods (check the plugin support in options) and has GPU monitoring graph too!! also on Radeons.