Article menu:
1 – Atomic Counters: Overview
Some weeks ago I found this video showing in which order the fragments are rendered:
Pretty cool. But how does it work? Answer: thanks to the use of atomic counters.
Atomic counters are a new feature of OpenGL 4.2. Atomic counters are available in all stages: vertex, pixel, geometry, tessellation control and evaluation shaders. The complete specification is available here: GL_ARB_shader_atomic_counters.

In a word, an atomic counter is memory buffer (actually a buffer object that stores one or several unsigned int) that can be incremented (GLSL built-in function atomicCounterIncrement()) or decremented (GLSL built-in function atomicCounterDecrement()) by a shader.
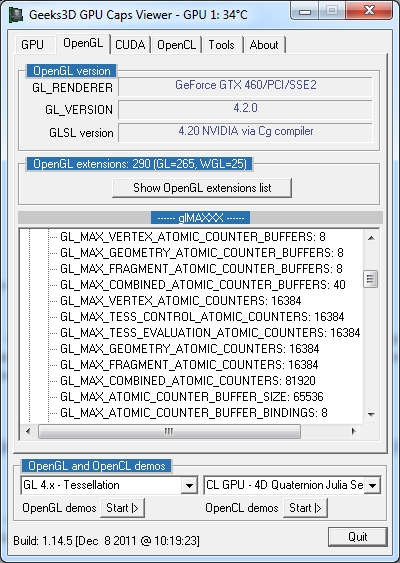
Information about atomic counters in GPU Caps Viewer
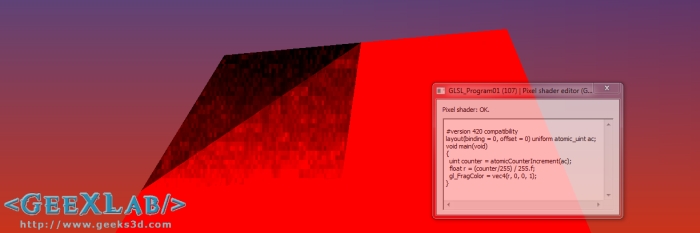
One simple but very interesting application of atomic counters is the visualization of the rendering order of fragments. In the pixel shader, an atomic counter is incremented each time the shader is invoked. Then if you convert the counter value to a color, you can quite easily visualize the order in which fragments are rendered. Nice!
Once the buffer object of the atomic counter is initialized and bound (see OpenGL code snippets at the end of the article), we can write to the atomic counter with the GLSL function atomicCounterIncrement().
The following code allows to shows where the ten first fragments are rendered:
#version 420 compatibility
layout(binding=0, offset=0) uniform atomic_uint ac;
void main(void)
{
  uint counter = atomicCounterIncrement(ac);
  if (counter < 10)
    gl_FragColor = vec4(1, 0, 0, 1);
  else
    gl_FragColor = vec4(0, 0, 0, 1);
}
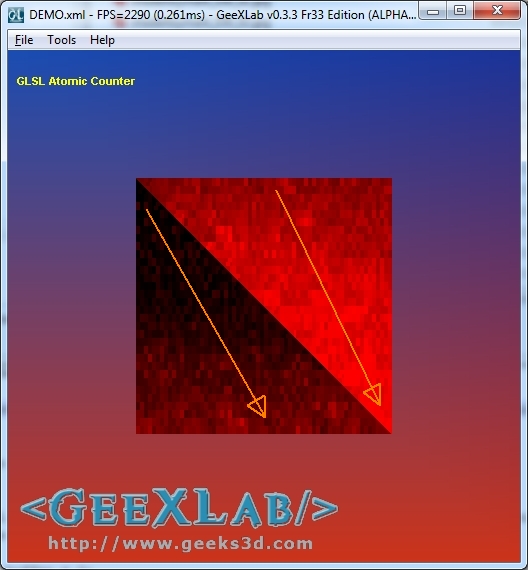
The following images shows these 10 first fragments:
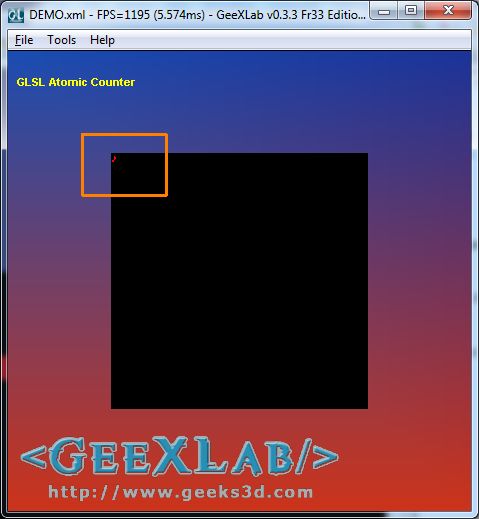
The ten first fragments
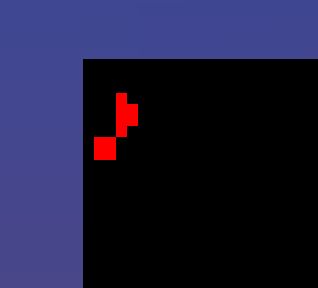
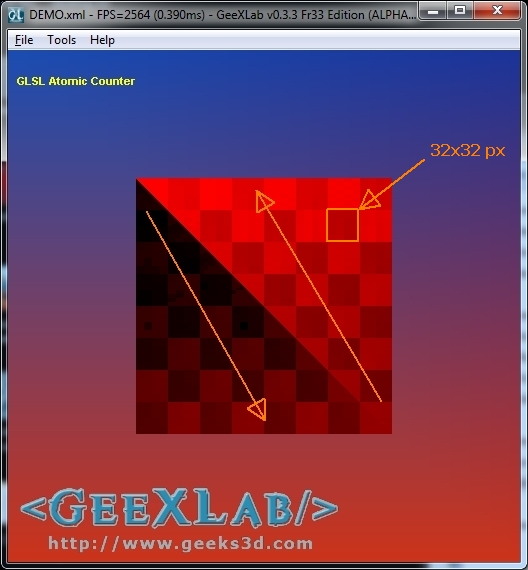
Zoom in on the ten first fragments
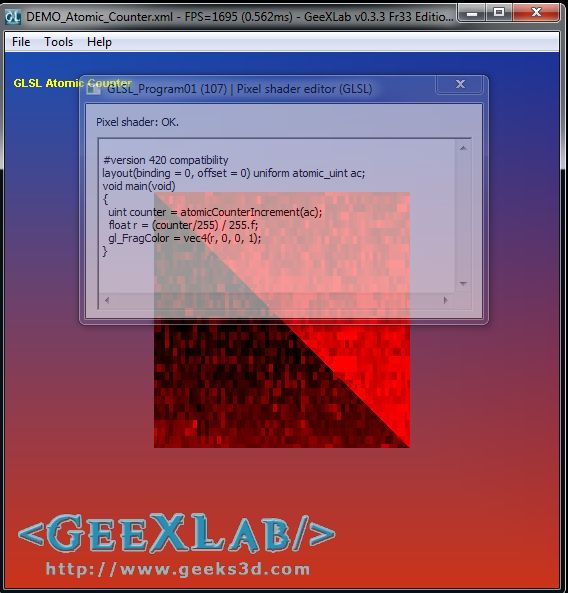
Now let's see the rendering order of all pixels of a quad (made up of 2 triangles) with the following shader:
#version 420 compatibility
layout(binding = 0, offset = 0) uniform atomic_uint ac;
void main(void)
{
  uint counter = atomicCounterIncrement(ac);
  float r = (counter/255) / 255.f;
  gl_FragColor = vec4(r, 0, 0, 1);
}
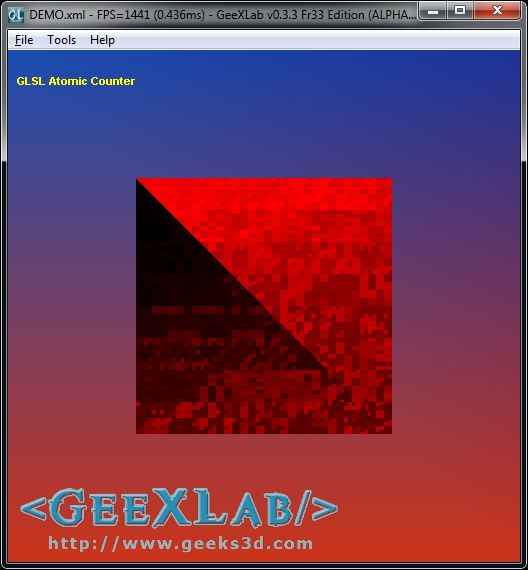
On the screen, the dimensions of the quad are 256x256 (65536 pixels to render). First fragments are rendered in black, last fragments are rendered in red. Here is the rendering order of a GeForce GTX 460:
Atomic counter, pixels rendering order on a GeForce GTX 460
And now the rendering order of a Radeon HD 6970:
Atomic counter, pixels rendering order on a Radeon HD 6970
Or do you prefer the rendering order of a Radeon HD 7770:
Atomic counter, pixels rendering order on a Radeon HD 7770
As you can see, the way the pixels are rendered (rasterizer pattern) is quite different. The GeForce draws many small areas and fills both triangles from top to the bottom while the Radeon GPU draws larger zones and fills one triangle from top to bottom and the second from bottom to top. The GPU of HD 6000 seems to draw fragments in group of 32x32 pixels (size of the squares you can see on the screenshot). Radeon HD 7000 GPU looks like more to GeForce GTX 400 rendering.
2 - Atomic Counters: the Demo
|
|
The demo for GeeXLab is available in the GLSL_Atomic_Counter/ folder of GeeXLab code sample pack: [download#40#image] This demo requires GeeXLab 0.3.3+. How to run the demo: start GeeXLab and drop the demo file (DEMO_Atomic_Counter.xml) in GeeXLab. That’s all. |
3 - Atomic Counters: OpenGL Details
For OpenGL developers, here are some pieces of code that show you how to init and use atomic counters. First thing, the OpenGL code to initialize an atomic counter buffer object:
GLuint ac_buffer = 0;
glGenBuffers(1, &ac_buffer);
glBindBuffer(GL_ATOMIC_COUNTER_BUFFER, ac_buffer);
glBufferData(GL_ATOMIC_COUNTER_BUFFER, sizeof(GLuint), NULL, GL_DYNAMIC_DRAW);
glBindBuffer(GL_ATOMIC_COUNTER_BUFFER, 0);
Now how to enable the atomic counter buffer object:
glBindBufferBase(GL_ATOMIC_COUNTER_BUFFER, 0, ac_buffer);
And to end up, how to reset the value of the atomic counter:
glBindBuffer(GL_ATOMIC_COUNTER_BUFFER, ac_buffer);
GLuint* ptr = (GLuint*)glMapBufferRange(GL_ATOMIC_COUNTER_BUFFER, 0, sizeof(GLuint),
                                        GL_MAP_WRITE_BIT |
                                        GL_MAP_INVALIDATE_BUFFER_BIT |
                                        GL_MAP_UNSYNCHRONIZED_BIT);
ptr[0] = value;
glUnmapBuffer(GL_ATOMIC_COUNTER_BUFFER);
glBindBuffer(GL_ATOMIC_COUNTER_BUFFER, 0);
That reminds me of another similar program for visualizing pixel fragments:
http://www.icare3d.org/blog_techno/gpu/the_froggy_fragsniffer.html
It’s old and probably won’t run properly on AMD hardware, due to OGL driver issues.
Ahah! That was my video 😀
Post something about it here:
http://www.g-truc.net/post-0434.html#menu
@fellix
The froggy fragsniffer works on AMD hardware has well and there is no OpenGL drivers issue for that.
However: using the The froggy fragsniffer requires tuning even on NVIDIA and will either produce not visible result or reboot your PC.
It also require WinXP because WinVista+ forbide the OpenGL drivers to directly render to the framebuffer.
On Radeon there is no reboot but we can’t see the expected result from Fragsniffer because AMD drivers render to a texture even on WinXP and then blit to the framebuffer.
what a mess! I don’t get why there is something like that. I always thought that framebuffer fills pixel by pixel, line by line, like old good ZX Spectrum screen
What a timing…
I just finished my own ‘rasterization order visualization’ demo based on atomic counters:
http://renderingpipeline.com/2012/03/gpu-rasterizer-pattern/
But instead of coloring the fragments based on the counter value I first stored them in an integer render target so in a second pass I can watch the rasterization in ‘slow motion’ (videos are online of a quad and a killeroo).
This kind of demo is realy the ‘hello world’ of atomic counters (or even OpenGL 4.2?) 😉
This would be very inefficient for the multiple caches a GPU contains. A more efficient and classic pattern is this one: http://en.wikipedia.org/wiki/Z-order_curve
We see that most of a processing order of the Radeons is done Z-order because atomic operation and fragment execution are synchronous.
However, on GeForce there are asynchronous so we can only see the high level patterns of the fragment executions but I am pretty convince that the underlying execution of the fragments follows a sort of Z-order approach.
nice images 🙂
The chess pattern on the Radeon HD 6970 is interesting.
Neither assumed that they changed such fundamental things between the HD6xxx & HD7xxx series.
it seems my 560Ti has a problem with this demo, I got only around 30 fps and demo is stuttering badly, I use the latest WHQL drivers
Hmm, couldn’t you use this to measure vertex cacheing by incrementing a per-vertex counter in the VS ?
That way you should be able to see how often a vertex shader runs for each vertex.
mbentrup: You can’t do that. While you can visualize the run-order of the vertex shader and how it’s interlaced with the fragment shader (see my post about rasterization order and specificly this video: http://www.youtube.com/watch?v=5vEAO6icz7M ), vertex caching (post-transformation cache) must be switched off when you use atomic counters. The cache assumes that the vertex shader is deterministic which it was up till OpenGL 4.2 with the introduction of atomic counters – such a cache itself is not part of the OpenGL specs and caching a VS that is indeterministic would produce non spec-conform output. The shader compiler has to check for such side-effects and switch the cache off in such cases… (similar: the early z-test gets switched off as soon as the FS modifies the Z value)
The OpenGL 4.2 spec explicitly states in the chapter about Memory Access Ordering that the number of Vertex shader invocations for a single vertex is implementation-defined, so there’s no reason to turn the Vertex cache off.
mbentrup: your right. Sadly, there is no guarantee that the behaviour with the counters is the same as without them. But worth a shot.