Common ranking tables (1920×1080) referenced by Geeks3D’s graphics cards reviews.
Quick links:
- 1 – 3DMark 2013
- 1.1 – Ice Storm
- 1.2 – Cloud Gate
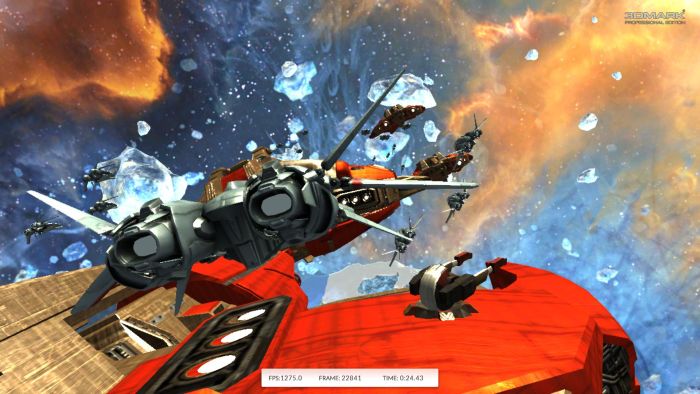
- 1.3 – Sky Diver
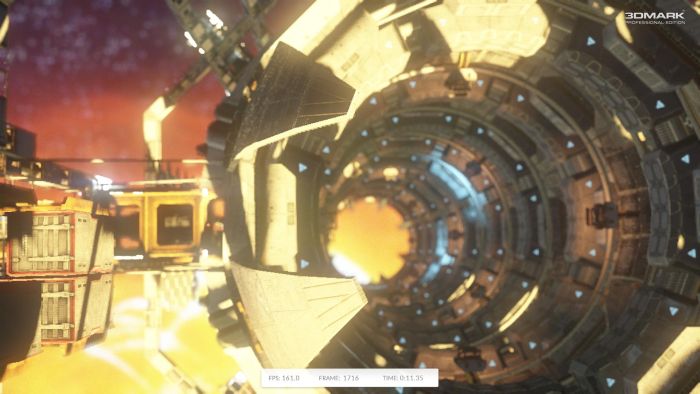
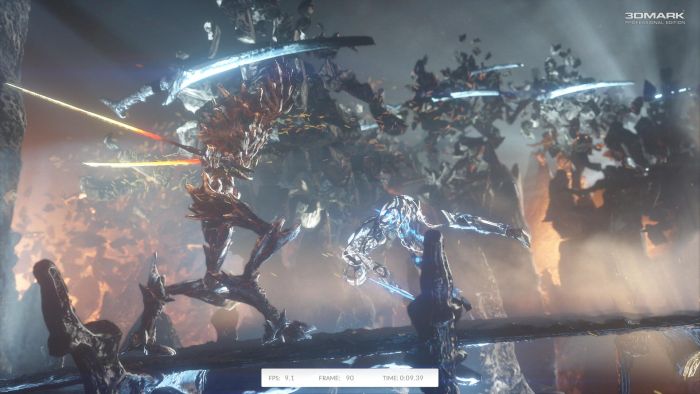
- 1.4 – Fire Strike
- 2 – Alien vs Predator
- 3 – FurMark
- 4 – Unigine Valley
- 5 – Catzilla
- 6 – MSI Kombustor
- 6.1 – Plasma (OpenGL 4.3)
- 6.2 – Julia 4D (OpenCL)
- 6.3 – Lakes of Titan
- 7 – GPU Test
- 7.1 – Volplosion
- 7.2 – Julia FP32
- 7.3 – Julia FP64
- 8 – Resident Evil 6
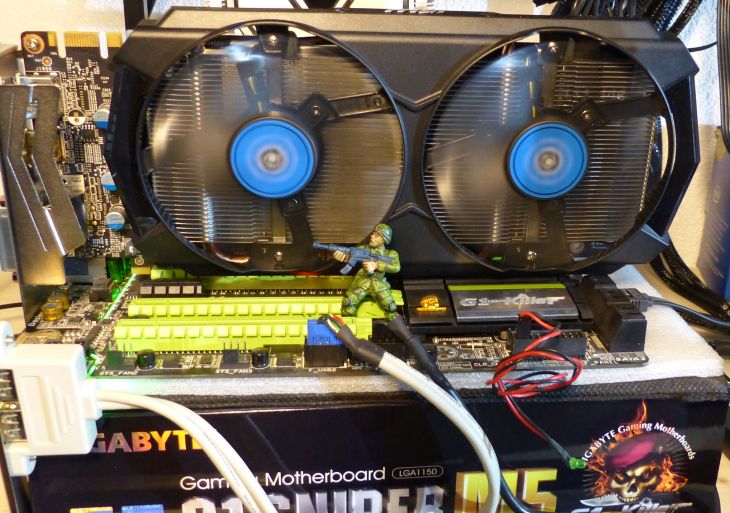
Testbed:
- motherboard: GIGABYTE G.SNIPER M5
- CPU: Intel Core i5 4670K @ 3.4GHz
- RAM: 16GB of DDR3 @ 1600MHz G-Skill
- PSU: Corsair AX 860i
- OS: Win 8 64-bit
1 – 3DMark (2013)
More information about 3DMark can be found HERE.
1.1 – Ice Storm
Ice Storm is a Direct3D 9 benchmark intended for smartphone, tablet, ultra-portable notebook or entry-level PC. As you can see, most of the graphics cards tested here have more of less the same score, the graphics workload being not enough heavy for decent desktop graphics cards.
| 160118 – ASUS GeForce GTX 980 Ti – R353.06 |
| 158213 – Gainward GeForce GTX 970 Phantom – R344.75 |
| 157738 – ASUS GeForce GTX 980 Strix – R344.75 |
| 156740 – EVGA GeForce GTX 780 – R344.75 |
| 154609 – EVGA GeForce GTX 680 – R344.75 |
| 153590 – MSI GTX 970 CLASSIC 4GD5T OC – R344.75 |
| 153007 – EVGA GeForce GTX 580 – R344.75 |
| 150755 – MSI Radeon HD 7970 – Catalyst 14.9 WHQL |
| 150479 – EVGA GeForce GTX 480 – R344.75 |
| 144600 – Sapphire Radeon HD 6970 – Catalyst 14.9 WHQL |
| 144835 – MSI Radeon R9 290X Gaming – Catalyst 14.9 WHQL |
| 136105 – ASUS Radeon HD 7770 DC – Catalyst 14.9 WHQL |
| 134354 – ASUS GeForce GTX 750 – R344.75 |
| 128680 – ASUS Strix GTX 960 DC2 OC 4GB – R353.06 |
| 123345 – MSI GTX 660 Hawk – R353.06 |
| 104568 – GIGABYTE BRIX GTX 760 |
| 82952 – ASUS G551Jw notebook w/ GTX 960M 4GB + R353.06 |
| 73517 – Radeon HD 8670D (AMD A10-6800K) |
| 42661 – ASUS Zenbook notebook w/ GT 940M + R353.06 |
1.2 – 3DMark Cloud Gate
Cloud Gate is a Direct3D 10 benchmark designed for Windows notebooks and typical home PCs with level entry graphics cards. For mid and high end graphics cards, this benchmark is a bit pointless.
| 19300 – ASUS GeForce GTX 980 Ti – R353.06 |
| 18853 – ASUS GeForce GTX 980 Strix – R344.75 |
| 18577 – Gainward GeForce GTX 970 Phantom – R344.75 |
| 18423 – MSI Radeon R9 290X Gaming – Catalyst 14.9 WHQL |
| 18099 – MSI GTX 970 CLASSIC 4GD5T OC – R344.75 |
| 17740 – EVGA GeForce GTX 780 – R344.75 |
| 16954 – MSI Radeon HD 7970 – Catalyst 14.9 WHQL |
| 16602 – EVGA GeForce GTX 680 – R344.75 |
| 16176 – ASUS Strix GTX 960 DC2 OC 4GB – R353.06 |
| 16162 – ASUS Turbo GTX 960 OC 2GB – R353.06 |
| 16056 – ASUS G551Jw notebook w/ GTX 960M 4GB + R353.06 |
| 15789 – EVGA GeForce GTX 580 – R344.75 |
| 14796 – EVGA GeForce GTX 480 – R344.75 |
| 14673 – MSI GTX 660 Hawk – R353.06 |
| 14204 – Sapphire Radeon HD 6970 – Catalyst 14.9 WHQL |
| 13498 – ASUS GeForce GTX 750 – R344.75 |
| 12373 – ASUS Radeon HD 7770 DC – Catalyst 14.9 WHQL |
| 10778 – GIGABYTE BRIX GTX 760 |
| 6574 – Radeon HD 8670D (AMD A10-6800K) |
| 5979 – ASUS Zenbook notebook w/ GT 940M + R353.06 |
1.3 – 3DMark Sky Diver
Sky Diver is a Direct3D 11 benchmark for gaming laptops and mid-range PCs. With this benchmark, scores distribution is getting interesting.

| 25134 – ASUS GeForce GTX 980 Ti – R353.06 |
| 23038 – ASUS GeForce GTX 980 Strix – R344.75 |
| 21964 – MSI Radeon R9 290X Gaming – Catalyst 14.9 WHQL |
| 21811 – Gainward GeForce GTX 970 Phantom – R344.75 |
| 20479 – MSI GTX 970 CLASSIC 4GD5T OC – R344.75 |
| 20274 – EVGA GeForce GTX 780 – R344.75 |
| 17570 – MSI Radeon HD 7970 – Catalyst 14.9 WHQL |
| 17533 – EVGA GeForce GTX 680 – R344.75 |
| 17494 – ASUS Strix GTX 960 DC2 OC 4GB – R353.06 |
| 17390 – ASUS Turbo GTX 960 OC 2GB – R353.06 |
| 14631 – MSI GTX 660 Hawk – R353.06 |
| 13069 – EVGA GeForce GTX 580 – R344.75 |
| 13028 – ASUS G551Jw notebook w/ GTX 960M 4GB + R353.06 |
| 11457 – EVGA GeForce GTX 480 – R344.75 |
| 11323 – ASUS GeForce GTX 750 – R344.75 |
| 11128 – Sapphire Radeon HD 6970 – Catalyst 14.9 WHQL |
| 10451 – ASUS Radeon HD 7770 DC – Catalyst 14.9 WHQL |
| 8928 – GIGABYTE BRIX GTX 760 |
| 5331 – ASUS Zenbook notebook w/ GT 940M + R353.06 |
1.4 – 3DMark Fire Strike
Fire Strike is a Direct3D 11 benchmark for high-performance gaming PCs with serious graphics cards.
| 12514 – ASUS GeForce GTX 980 Ti – R353.06 |
| 10574 – ASUS GeForce GTX 980 Strix – R344.75 |
| 9447 – Gainward GeForce GTX 970 Phantom – R344.75 |
| 9382 – MSI Radeon R9 290X Gaming – Catalyst 14.9 WHQL |
| 8870 – MSI GTX 970 CLASSIC 4GD5T OC – R344.75 |
| 8203 – EVGA GeForce GTX 780 – R344.75 |
| 6572 – MSI Radeon HD 7970 – Catalyst 14.9 WHQL |
| 6399 – ASUS Strix GTX 960 DC2 OC 4GB – R353.06 |
| 6248 – ASUS Turbo GTX 960 OC 2GB – R353.06 |
| 6235 – EVGA GeForce GTX 680 – R344.75 |
| 4857 – MSI GTX 660 Hawk – R353.06 |
| 4392 – EVGA GeForce GTX 580 – R344.75 |
| 4022 – ASUS G551Jw notebook w/ GTX 960M 4GB + R353.06 |
| 3562 – ASUS GeForce GTX 750 – R344.75 |
| 3159 – Sapphire Radeon HD 6970 – Catalyst 14.9 WHQL |
| 2960 – EVGA GeForce GTX 480 – R344.75 |
| 2953 – GIGABYTE BRIX GTX 760 |
| 2905 – ASUS Radeon HD 7770 DC – Catalyst 14.9 WHQL |
| 1386 – ASUS Zenbook notebook w/ GT 940M + R353.06 |
| 1173 – Radeon HD 8670D (AMD A10-6800K) |
2 – Alien vs Predator
Alien vs Predator (or AvP) is a Direct3D 11 benchmark with tessellation and high quality shadows. AvP can be downloaded from this page.

Settings: Resolution: 1920 x 1080, Texture Quality: 2, Shadow Quality: 3, Anisotropic Filtering: 16, SSAO: ON, Vertical Sync: OFF, DX11 Tessellation: ON, DX11 Advanced Shadows: ON, DX11 MSAA Samples: 1.
| 229 FPS – ASUS GeForce GTX 980 Ti – R353.06 |
| 180.3 FPS – ASUS GeForce GTX 980 Strix – R344.75 |
| 159.9 FPS – Gainward GeForce GTX 970 Phantom – R344.75 |
| 151.5 FPS – MSI GTX 970 CLASSIC 4GD5T OC – R344.75 |
| 147.8 FPS – MSI Radeon R9 290X Gaming – Catalyst 14.9 WHQL |
| 138 FPS – EVGA GeForce GTX 780 – R344.75 |
| 103.1 FPS – EVGA GeForce GTX 680 – R344.75 |
| 102.6 FPS – MSI Radeon HD 7970 – Catalyst 14.9 WHQL |
| 97.8 FPS – ASUS Strix GTX 960 DC2 OC 4GB – R353.06 |
| 97.1 FPS – ASUS Turbo GTX 960 OC 2GB – R353.06 |
| 78.8 FPS – MSI GTX 660 Hawk – R353.06 |
| 76.6 FPS – EVGA GeForce GTX 580 – R344.75 |
| 65.7 FPS – Sapphire Radeon HD 6970 – Catalyst 14.9 WHQL |
| 63.8 – EVGA GeForce GTX 480 – R344.75 |
| 57.2 FPS – ASUS GeForce GTX 750 – R344.75 |
| 57.1 – ASUS G551Jw notebook w/ GTX 960M 4GB + R353.06 |
| 42 FPS – GIGABYTE BRIX GTX 760 |
| 38.3 FPS – ASUS Radeon HD 7770 DC – Catalyst 14.9 WHQL |
3 – FurMark 1.15
FurMark is an OpenGL 2 benchmark that renders a furry donut. This benchmark is known for its extreme GPU workload.
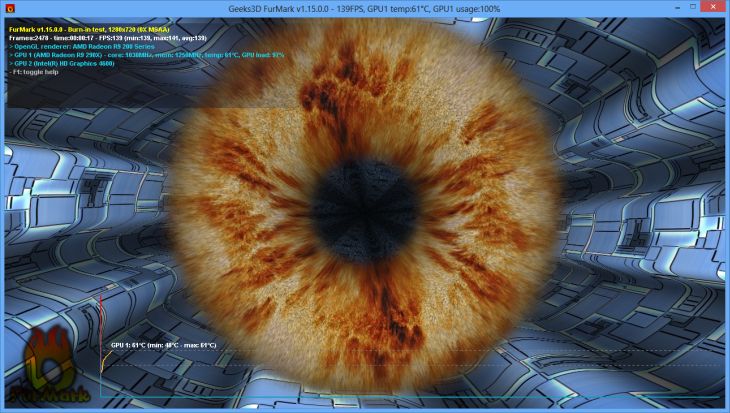
Settings: Preset:1080
| 6233 points (103 FPS) – ASUS GeForce GTX 980 Ti – R353.06 |
| 4660 points (77 FPS) – ASUS GeForce GTX 980 Strix – R344.75 |
| 4592 points (76 FPS) – MSI Radeon R9 290X Gaming – Catalyst 14.9 WHQL |
| 4166 points (69 FPS) – Gainward GeForce GTX 970 Phantom – R344.75 |
| 4050 points (67 FPS) – EVGA GeForce GTX 780 – R344.75 |
| 3335 points (55 FPS) – MSI GTX 970 CLASSIC 4GD5T OC – R344.75 |
| 2951 points (49 FPS) – MSI Radeon HD 7970 – Catalyst 14.9 WHQL |
| 2733 points (45 FPS) – EVGA GeForce GTX 680 – R344.75 |
| 2566 points (42 FPS) – ASUS Strix GTX 960 DC2 OC 4GB – R353.06 |
| 2536 points (42 FPS) – ASUS Turbo GTX 960 OC 2GB – R353.06 |
| 2162 points (36 FPS) – MSI GTX 660 Hawk – R353.06 |
| 1777 points (29 FPS) – EVGA GeForce GTX 480 – R344.75 |
| 1738 points (28 FPS) – Sapphire Radeon HD 6970 – Catalyst 14.9 WHQL |
| 1409 points (23 FPS) – GIGABYTE BRIX GTX 760 |
| 1339 points (22 FPS) – ASUS GeForce GTX 750 – R344.75 |
| 1116 points (18 FPS – Wrong score / GPU throttling caused by NVIDIA driver / ocp) – EVGA GeForce GTX 580 – R344.75 |
| 1030 points (17 FPS) – ASUS Radeon HD 7770 DC – Catalyst 14.9 WHQL |
| 1008 points (16 FPS) – ASUS G551Jw notebook w/ GTX 960M 4GB + R353.06 |
| 225 points (3 FPS) – ASUS Zenbook notebook w/ GT 940M + R353.06 |
Remarks
– the low score of GIGABYTE BRIX GTX 760 is caused by too much GPU core clock throttling (NVIDIA drivers).
– the low score of MSI GTX 970 CLASSIC 4GD5T OC is caused by a little bit too much GPU core clock throttling (NVIDIA drivers).
– the low score of GTX 960M (ASUS G551Jw) is caused by too much GPU core clock throttling (NVIDIA drivers).
4 – Unigine Valley 1.0
Unigine Valley is a Direct3D/OpenGL benchmark from the same dev team than Unigine Heaven. More information can be found HERE and HERE.
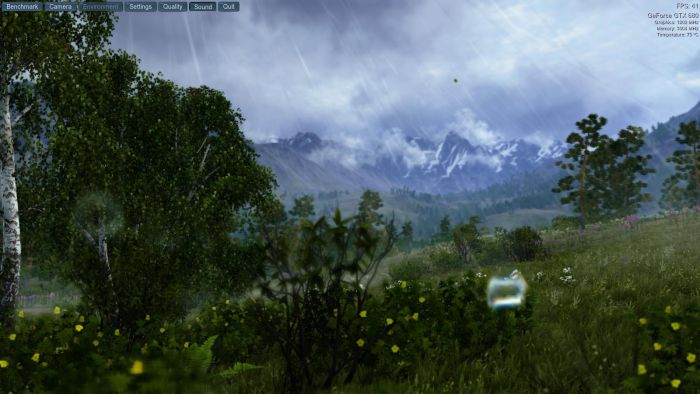
Settings: Extreme HD (Direct3D, 1920×1080 fullscreen, 8X MSAA)
| 86.1 FPS, Score: 3602 – ASUS GeForce GTX 980 Ti – R353.06 |
| 67.8 FPS, Score: 2837 – ASUS GeForce GTX 980 Strix – R344.75 |
| 61.7 FPS, Score: 2582 – MSI Radeon R9 290X Gaming – Catalyst 14.9 WHQL |
| 58.7 FPS, Score: 2457 – Gainward GeForce GTX 970 Phantom – R344.75 |
| 57.8 FPS, Score: 2418 – EVGA GeForce GTX 780 – R344.75 |
| 56.0 FPS, Score: 2344 – MSI GTX 970 CLASSIC 4GD5T OC – R344.75 |
| 42.9 FPS, Score: 1796 – EVGA GeForce GTX 680 – R344.75 |
| 39.9 FPS, Score: 1668 – MSI Radeon HD 7970 – Catalyst 14.9 WHQL |
| 35.8 FPS, Score: 1500 – ASUS Strix GTX 960 DC2 OC 4GB – R353.06 |
| 35.6 FPS, Score: 1491 – ASUS Turbo GTX 960 OC 2GB – R353.06 |
| 34.6 FPS, Score: 1446 – EVGA GeForce GTX 580 – R344.75 |
| 32.4 FPS, Score: 1358 – MSI GTX 660 Hawk – R353.06 |
| 29.3 FPS, Score: 1224 – Sapphire Radeon HD 6970 – Catalyst 14.9 WHQL |
| 25.6 FPS, Score: 1071 – EVGA GeForce GTX 480 – R344.75 |
| 19.4 FPS, Score: 812 – ASUS GeForce GTX 750 – R344.75 |
| 19.5 FPS, Score: 816 – GIGABYTE BRIX GTX 760 |
| 18.2 FPS, Score: 769 – ASUS G551Jw notebook w/ GTX 960M 4GB + R353.06 |
| 16.2 FPS, Score: 679 – ASUS Radeon HD 7770 DC – Catalyst 14.9 WHQL |
5 – Catzilla
Catzilla is a Direct3D / OpenGL graphics benchmark. More information is available HERE.
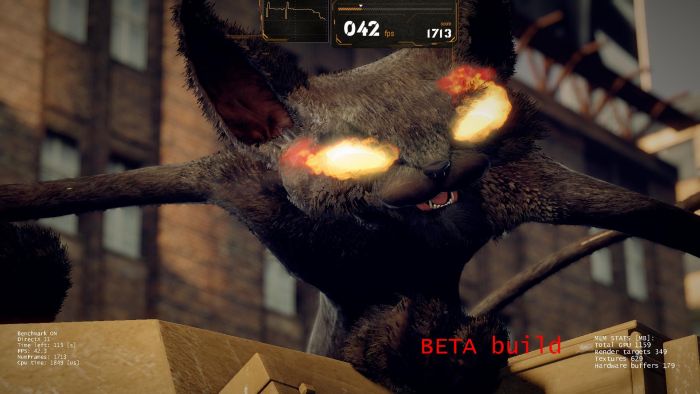
Settings: 720p
| 27195 – ASUS GeForce GTX 980 Ti – R353.06 |
| 26181 – ASUS GeForce GTX 980 Strix – R344.75 |
| 23740 – Gainward GeForce GTX 970 Phantom – R344.75 |
| 21410 – MSI GTX 970 CLASSIC 4GD5T OC – R344.75 |
| 20309 – EVGA GeForce GTX 780 – R344.75 |
| 18032 – MSI Radeon R9 290X Gaming – Catalyst 14.9 WHQL |
| 16260 – EVGA GeForce GTX 680 – R344.75 |
| 13969 – ASUS Strix GTX 960 DC2 OC 4GB – R353.06 |
| 11550 – MSI Radeon HD 7970 – Catalyst 14.9 WHQL |
| 11495 – MSI GTX 660 Hawk – R353.06 |
| 10256 – EVGA GeForce GTX 580 – R344.75 |
| 8679 – Sapphire Radeon HD 6970 – Catalyst 14.9 WHQL |
| 8463 – EVGA GeForce GTX 480 – R344.75 |
| 8036 – ASUS G551Jw notebook w/ GTX 960M 4GB + R353.06 |
| 7467 – ASUS GeForce GTX 750 – R344.75 |
| 5234 – ASUS Radeon HD 7770 DC – Catalyst 14.9 WHQL |
6 – MSI Kombustor 3.5.x
More information about MSI Kombustor and download links can be found MSI Kombustor Homepage.
6.1 – Plasma (OpenGL 4.3, compute shaders + SSBO)
Plasma is a particle based test that uses OpenGL 4.3 features such as compute shaders and SSBO.
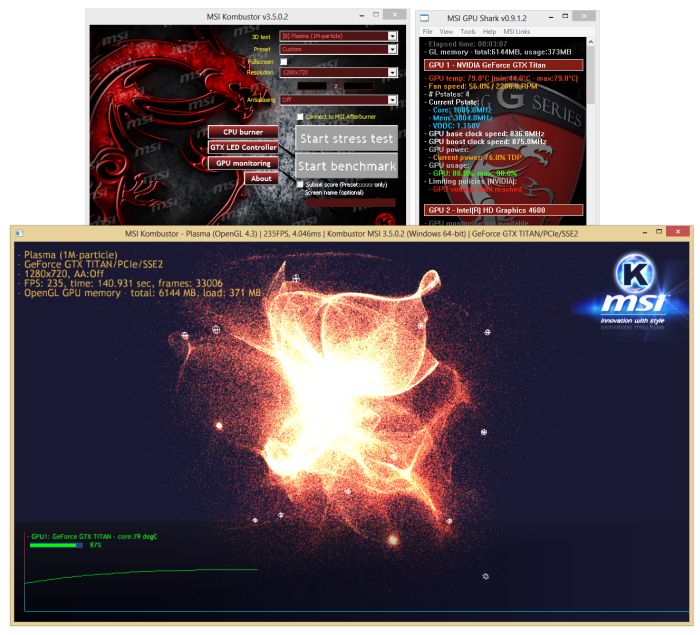
Settings: Preset:1080
| 21437 points (357 FPS) – ASUS GeForce GTX 980 Ti – R353.06 |
| 19472 points (324 FPS) – ASUS GeForce GTX 980 Strix – R344.75 |
| 19195 points (319 FPS) – MSI Radeon R9 290X Gaming – Catalyst 14.9 WHQL |
| 18638 points (310 FPS) – Gainward GeForce GTX 970 Phantom – R344.75 |
| 18155 points (302 FPS) – MSI GTX 970 CLASSIC 4GD5T OC – R344.75 |
| 15925 points (265 FPS) – EVGA GeForce GTX 780 – R344.75 |
| 11590 points (193 FPS) – EVGA GeForce GTX 680 – R344.75 |
| 11522 points (192 FPS) – ASUS Strix GTX 960 DC2 OC 4GB – R353.06 |
| 11364 points (189 FPS) – MSI Radeon HD 7970 – Catalyst 14.9 WHQL |
| 9187 points (153 FPS) – EVGA GeForce GTX 580 – R344.75 |
| 7947 points (132 FPS) – EVGA GeForce GTX 480 – R344.75 |
| 7803 points (130 FPS) – ASUS GeForce GTX 750 – R344.75 |
| 4245 points (70 FPS) – Sapphire Radeon HD 6970 – Catalyst 14.9 WHQL |
| 4038 points (67 FPS) – ASUS Radeon HD 7770 DC – Catalyst 14.9 WHQL |
| 2364 points (39 FPS) – ASUS G551Jw notebook w/ GTX 960M 4GB + R353.06 |
| 497 points (8 FPS)- ASUS Zenbook notebook w/ GT 940M + R353.06 |
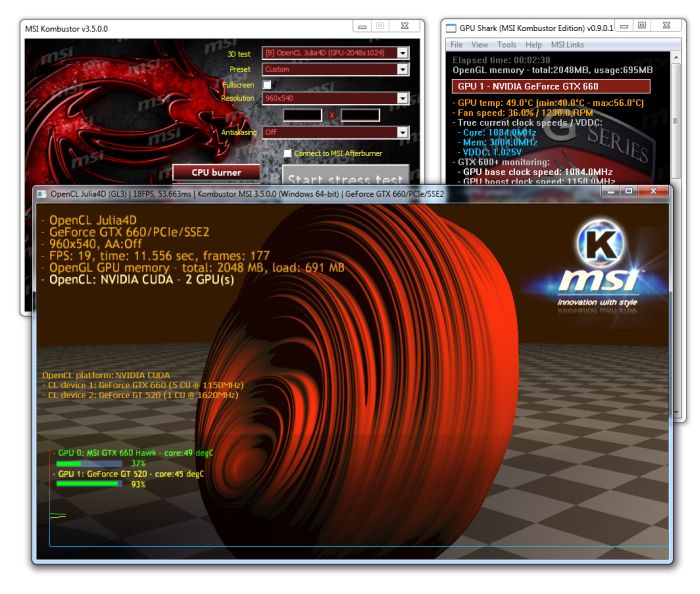
6.2 – Julia 4D (GPU OpenCL)
Julia 4D is an OpenCL test that computes a Julia 4D fractal.
Settings: Preset:1080
| 9494 points (158 FPS) – ASUS GeForce GTX 980 Ti – R353.06 |
| 7731 points (128 FPS) – ASUS GeForce GTX 980 Strix – R344.75 |
| 6621 points (110 FPS) – Gainward GeForce GTX 970 Phantom – R344.75 |
| 6225 points (103 FPS) – MSI GTX 970 CLASSIC 4GD5T OC – R344.75 |
| 5434 points (90 FPS) – EVGA GeForce GTX 780 – R344.75 |
| 4642 points (77 FPS) – ASUS Strix GTX 960 DC2 OC 4GB – R353.06 |
| 4556 points (75 FPS) – MSI Radeon R9 290X Gaming – Catalyst 14.9 WHQL |
| 4450 points (74 FPS) – EVGA GeForce GTX 680 – R344.75 |
| 2614 points (43 FPS) – MSI Radeon HD 7970 – Catalyst 14.9 WHQL |
| 2591 points (43 FPS) – EVGA GeForce GTX 580 – R344.75 |
| 2149 points (35 FPS) – EVGA GeForce GTX 480 – R344.75 |
| 1863 points (31 FPS) – ASUS GeForce GTX 750 – R344.75 |
| 1786 points (29 FPS) – ASUS G551Jw notebook w/ GTX 960M 4GB + R353.06 |
| 1644 points (27 FPS) – ASUS Radeon HD 7770 DC – Catalyst 14.9 WHQL |
| 1033 points (17 FPS) – ASUS Zenbook notebook w/ GT 940M + R353.06 |
| 1015 points (16 FPS) – Sapphire Radeon HD 6970 – Catalyst 14.9 WHQL |
| 672 points (11 FPS) – Intel Graphics HD 4600 (Core i5 4670K @ 3.4GHz) |
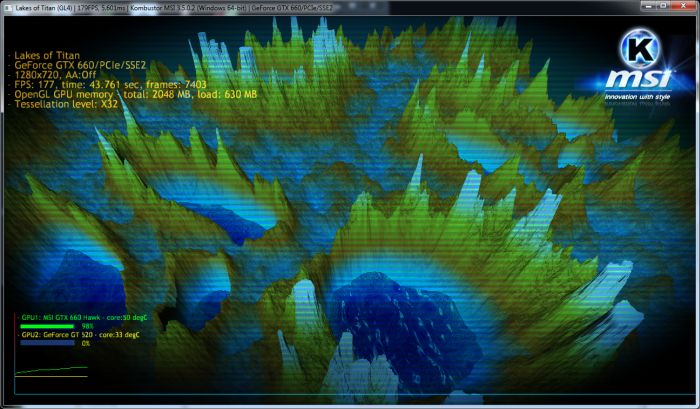
6.3 – Lakes of Titan (OpenGL 4.0 tessellation)
Lakes of Titan is an OpenGL 4.0 test that renders a limited and imaginary part of Titan, one of Saturn’s satellites. The test is based on OpenGL 4.0 tessellation shaders.
Settings: Preset:1080
| 122465 points (204 FPS) – ASUS GeForce GTX 980 Ti – R353.06 |
| 9722 points (162 FPS) – ASUS GeForce GTX 980 Strix – R344.75 |
| 9038 points (150 FPS) – EVGA GeForce GTX 780 – R344.75 |
| 9002 points (150 FPS) – Gainward GeForce GTX 970 Phantom – R344.75 |
| 8860 points (147 FPS) – MSI GTX 970 CLASSIC 4GD5T OC – R344.75 |
| 6604 points (110 FPS) – EVGA GeForce GTX 680 – R344.75 |
| 5738 points (95 FPS) – MSI Radeon R9 290X Gaming – Catalyst 14.9 WHQL |
| 5554 points (92 FPS) – ASUS Strix GTX 960 DC2 OC 4GB – R353.06 |
| 5227 points (87 FPS) – EVGA GeForce GTX 580 – R344.75 |
| 4512 points (75 FPS) – EVGA GeForce GTX 480 – R344.75 |
| 4483 points (74 FPS) – MSI Radeon HD 7970 – Catalyst 14.9 WHQL |
| 3104 points (51 FPS) – ASUS GeForce GTX 750 – R344.75 |
| 2468 points (41 FPS) – ASUS Radeon HD 7770 DC – Catalyst 14.9 WHQL |
| 2293 points (38 FPS) – ASUS G551Jw notebook w/ GTX 960M 4GB + R353.06 |
| 2108 points (35 FPS) – Sapphire Radeon HD 6970 – Catalyst 14.9 WHQL |
| 995 points (16 FPS) – ASUS Zenbook notebook w/ GT 940M + R353.06 |
7 – GPU Test 0.7.0
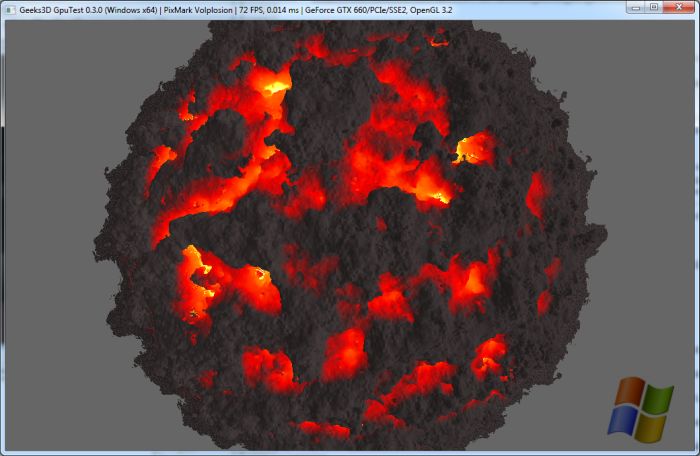
7.1 – Volplosion (100% math / pixel shader test)
Volplosion is an OpenGL 3.2 pixel shader test that performs lot of maths to render the scene. This test requires a lot of raw processing power from the GPU!
Settings: 1920×1080 fullscreen.
| 5198 points (86 FPS) – ASUS GeForce GTX 980 Ti – R353.06 |
| 4602 points (76 FPS) – ASUS GeForce GTX 980 Strix – R344.75 |
| 4055 points (67 FPS) – Gainward GeForce GTX 970 Phantom – R344.75 |
| 3768 points (62 FPS) – MSI GTX 970 CLASSIC 4GD5T OC – R344.75 |
| 3324 points (55 FPS) – MSI Radeon R9 290X Gaming – Catalyst 14.9 WHQL |
| 2668 points (44 FPS) – EVGA GeForce GTX 780 – R344.75 |
| 2590 points (43 FPS) – ASUS Strix GTX 960 DC2 OC 4GB – R353.06 |
| 1986 points (33 FPS) – EVGA GeForce GTX 680 – R344.75 |
| 1711 points (28 FPS) – Sapphire Radeon HD 6970 – Catalyst 14.9 WHQL |
| 1606 points (26 FPS) – MSI Radeon HD 7970 – Catalyst 14.9 WHQL |
| 1433 points (23 FPS) – EVGA GeForce GTX 580 – R344.75 |
| 1182 points (19 FPS) – EVGA GeForce GTX 480 – R344.75 |
| 1121 points (18 FPS) – ASUS GeForce GTX 750 – R344.75 |
| 991 points (16 FPS) – ASUS G551Jw notebook w/ GTX 960M 4GB + R353.06 |
| 624 points (10 FPS) – ASUS Radeon HD 7770 DC – Catalyst 14.9 WHQL |
7.2 – Julia FP32
Julia FP32 is an OpenGL 3.2 pixel shader test that renders a 2D Julia fractal using single precision floating point numbers (FP32).
Settings: 1920×1080 fullscreen.
| 48423 points (805 FPS) – ASUS GeForce GTX 980 Ti – R353.06 |
| 43480 points (721 FPS) – MSI Radeon R9 290X Gaming – Catalyst 14.9 WHQL |
| 38383 points (638 FPS) – ASUS GeForce GTX 980 Strix – R344.75 |
| 37954 points (631 FPS) – MSI Radeon HD 7970 – Catalyst 14.9 WHQL |
| 35292 points (587 FPS) – MSI GTX 970 CLASSIC 4GD5T OC – R344.75 |
| 34766 points (578 FPS) – Gainward GeForce GTX 970 Phantom – R344.75 |
| 30500 points (507 FPS) – EVGA GeForce GTX 780 – R344.75 |
| 25524 points (424 FPS) – ASUS Strix GTX 960 DC2 OC 4GB – R353.06 |
| 23892 points (397 FPS) – EVGA GeForce GTX 680 – R344.75 |
| 19318 points (321 FPS) – ASUS Radeon HD 7770 DC – Catalyst 14.9 WHQL |
| 12856 points (213 FPS) – EVGA GeForce GTX 580 – R344.75 |
| 10715 points (178 FPS) – EVGA GeForce GTX 480 – R344.75 |
| 10381 points (172 FPS) – Sapphire Radeon HD 6970 – Catalyst 14.9 WHQL |
| 9324 points (155 FPS) – ASUS GeForce GTX 750 – R344.75 |
| 8604 points (143 FPS) – ASUS G551Jw notebook w/ GTX 960M 4GB + R353.06 |
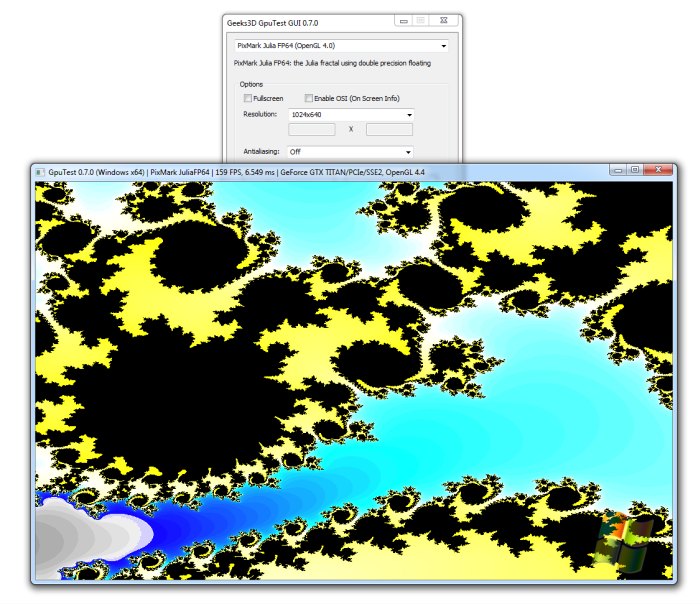
7.3 – Julia FP64 (OpenGL 4 FP64 test)
Julia FP32 is an OpenGL 4.0 pixel shader test that renders a 2D Julia fractal using double precision floating point numbers (FP64).
Settings: 1920×1080 fullscreen.
| 16929 points (281 FPS) – MSI Radeon HD 7970 – Catalyst 14.9 WHQL |
| 10518 points (175 FPS) – MSI Radeon R9 290X Gaming – Catalyst 14.9 WHQL |
| 5519 points (91 FPS) – Sapphire Radeon HD 6970 – Catalyst 14.9 WHQL |
| 3566 points (59 FPS) – EVGA GeForce GTX 580 – R344.75 |
| 2947 points (49 FPS) – EVGA GeForce GTX 480 – R344.75 |
| 2855 points (47 FPS) – ASUS GeForce GTX 980 Ti – R353.06 |
| 2855 points (47 FPS) – EVGA GeForce GTX 780 – R344.75 |
| 2256 points (37 FPS) – ASUS GeForce GTX 980 Strix – R353.06 |
| 2088 points (34 FPS) – ASUS Radeon HD 7770 DC – Catalyst 14.9 WHQL |
| 1912 points (31 FPS) – MSI GTX 970 CLASSIC 4GD5T OC – R344.75 |
| 1786 points (29 FPS) – Gainward GeForce GTX 970 Phantom – R344.75 |
| 1786 points (29 FPS) – EVGA GeForce GTX 680 – R344.75 |
| 1320 points (21 FPS) – ASUS Strix GTX 960 DC2 OC 4GB – R353.06 |
| 727 points (12 FPS) – ASUS G551Jw notebook w/ GTX 960M 4GB + R353.06 |
| 603 points (10 FPS) – ASUS GeForce GTX 750 – R344.75 |
8 – Resident Evil 6 Benchmark
Resident Evil 6 (RE6) is a Direct3D 9 benchmark. RE6 benchmark can be downloaded from this page.

Settings: Resolution: 1920 x 1080, anti-aliasing: FXAA3HQ, all params to high.
| 16332 points – MSI GTX 970 Classic – R353.06 |
| 13405 points – EVGA GTX 780 – R353.06 |
| 11935 points – ASUS Strix GTX 960 DC2 OC 4GB – R353.06 |
| 11442 points – EVGA GTX 680 – R353.06 |
| 8794 points – MSI GTX 660 Hawk – R353.06 |
| 5714 points – ASUS GTX 750 + R353.06 |
| 4495 points – ASUS G551Jw notebook w/ GTX 960M 4GB + R353.06 |