After assembling the testbed in this article, let’s look at the CPU and GPU performance of the Intel Core i5-12600K (Alder Lake architecture) processor. The performance of the i5-12600K (10 cores / 16 threads) will be compared with that of the Core i5-11600K (Rocket Lake, 6 cores / 12 threads) and the Ryzen 7 5800X (8 cores / 16 threads) in the following benchmarks: CPU-Z benchmark (CPU), Cinebench R23 (CPU), 7-Zip benchmark (CPU), FFmpeg (CPU) and FurMark (GPU).
| Alder Lake Test System | |
|---|---|
| CPU | Intel Core i5-12600K |
| Motherboard | ASUS PRIME Z690-P D4 |
| Memory | 16GB G.Skill Aegis DDR4-3200 |
| PSU | Corsair RM850x |
| OS | Windows 11 64-bit |
| Rocket Lake Test System | |
|---|---|
| CPU | Intel Core i5-11600K |
| Motherboard | ASUS TUF Z590 Plus |
| Memory | 16GB Corsair Vengeance PRO DDR4-3200 |
| PSU | Corsair RM850x |
| OS | Windows 10 64-bit |
| Ryzen Test System | |
|---|---|
| CPU | AMD Ryzen 7 5800X |
| Motherboard | ASUS TUF Gaming X570 Plus |
| Memory | 16GB Corsair Vengeance PRO DDR4-3200 |
| PSU | Corsair RM1000x |
| OS | Windows 10 64-bit |
1 – CPU Performance
1.1 – CPU-Z Benchmark
CPU-Z has a single and multithread CPU benchmark in the Bench panel.
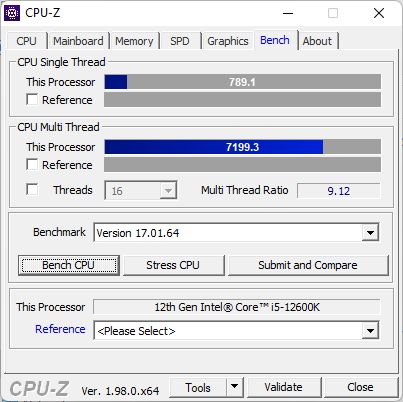
Single threaded test
| higher is better |
| 789 – Intel Core i5-12600K – Windows 11 64-bit |
| 662 – Intel Core i5-11600K – Windows 10 64-bit |
| 648 – AMD Ryzen 7 5800X – Windows 10 64-bit |
| 508 – Intel Core i7-8700K – Windows 10 64-bit |
Multithreaded test
| higher is better |
| 7199 – Intel Core i5-12600K – Windows 11 64-bit |
| 6621 – AMD Ryzen 7 5800X – Windows 10 64-bit |
| 4809 – Intel Core i5-11600K – Windows 10 64-bit |
| 3694 – Intel Core i7-8700K – Windows 10 64-bit |
1.2 – Cinebench R23
Cinebench is CPU benchmark based on Cinema4D. Cinebench offers single and multi-threaded CPU benchmark.
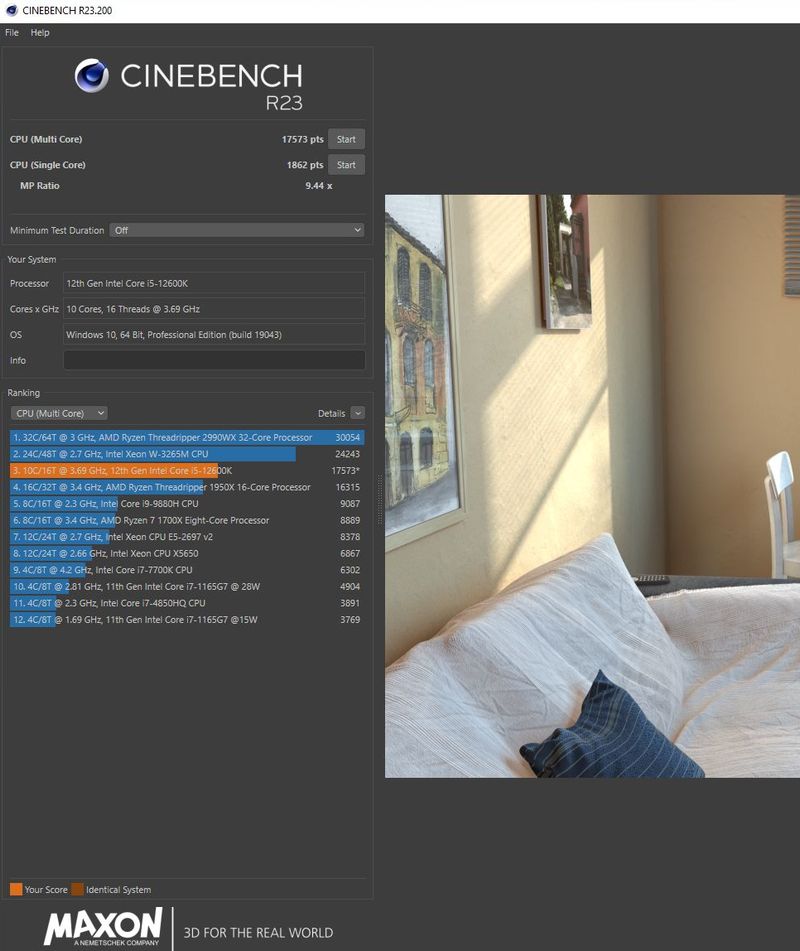
Single threaded test
| higher is better |
| 1862 – Intel Core i5-12600K – Windows 11 64-bit |
| 1582 – AMD Ryzen 7 5800X – Windows 10 64-bit |
| 1561 – Intel Core i5-11600K – Windows 10 64-bit |
| 1183 – Intel Core i7-8700K – Windows 10 64-bit |
In this test, the Core i5-12600K is +20% faster than previous gen Core i5-11600K.
Multithreaded test
Cinebench is an intensive multi-core CPU benchmark and stress test at the same time. I added close to the CPU name, the power consumption of the CPU during the benchmark (measured with CoreTemp).
| higher is better |
| 17573 – Intel Core i5-12600K (power: 134W) – Windows 11 64-bit |
| 15460 – AMD Ryzen 7 5800X (power: 142W) – Windows 10 64-bit |
| 11161 – Intel Core i5-11600K (power: 147W) – Windows 10 64-bit |
| 8616 – Intel Core i7-8700K (power: 90W) – Windows 10 64-bit |
In this test, the Core i5-12600K is +57% faster than previous gen Core i5-11600K.
1.3 – 7-Zip LZMA Benchmark
I discovered that the popular archive file utility 7-Zip comes with a built-in CPU benchmark module. There is even a website for all scores. To run the benchmark, start 7-Zip main interface, then launch Tools > Benchmark. In this benchmark, 7-Zip compresses and decompresses dummy data and shows the score in number of million (or giga) instructions per second (MIPS for older CPUs and GIPS for recent CPUs).
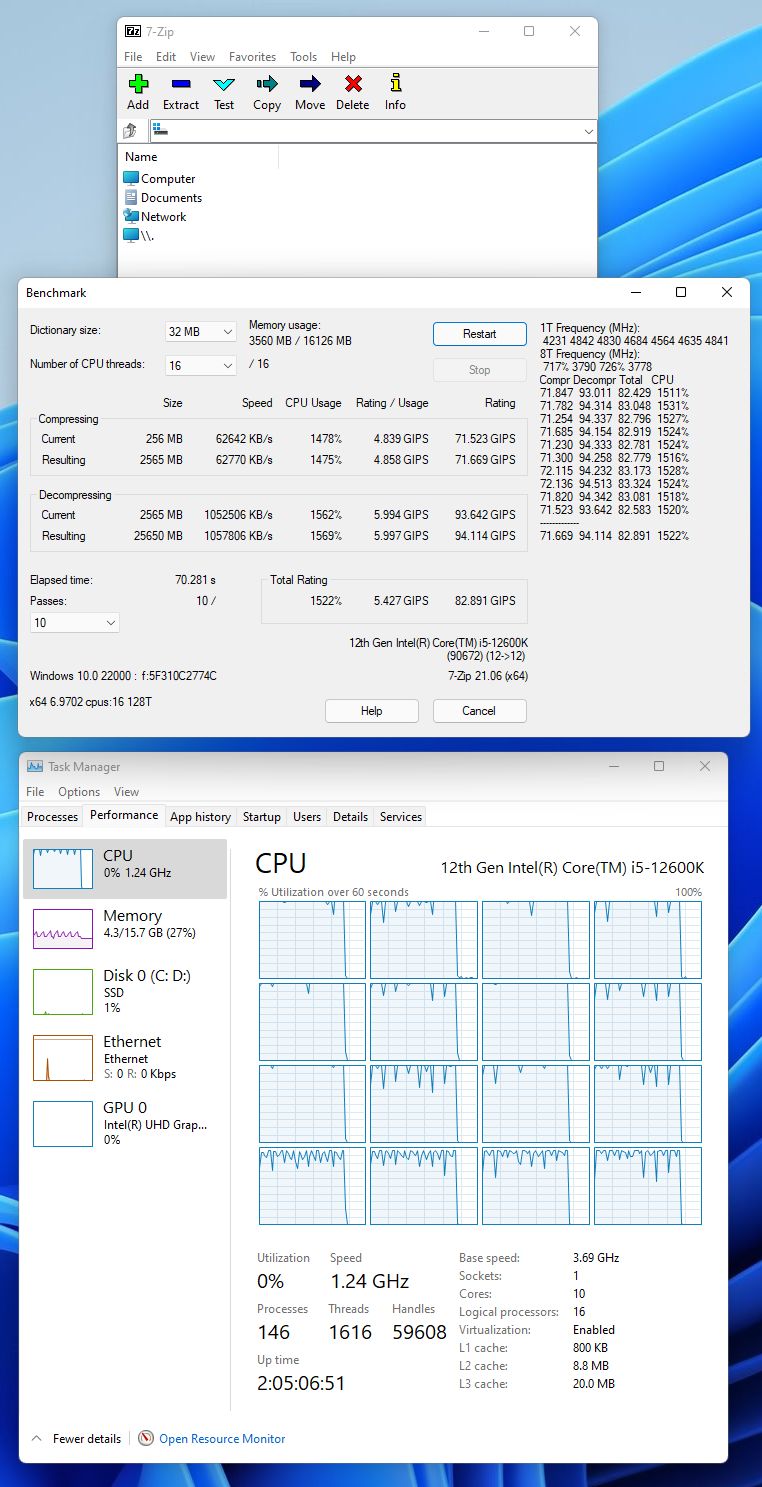
| higher is better |
| 105 GIPS (105062 MIPS) – AMD Ryzen 7 5800X – Windows 10 64-bit |
| 82 GIPS (82891 MIPS) – Intel Core i5-12600K – Windows 11 64-bit |
| 62 GIPS (62787 MIPS) – Intel Core i5-11600K (power: 147W) – Windows 10 64-bit |
| 52 GIPS (52066 MIPS) – Intel Core i7-8700K – Windows 10 64-bit |
In this test, the Core i5-12600K is +30% faster than previous gen Core i5-11600K. But the king is the Ryzen 7 5800X that is 28% faster than the core i5-12600K.
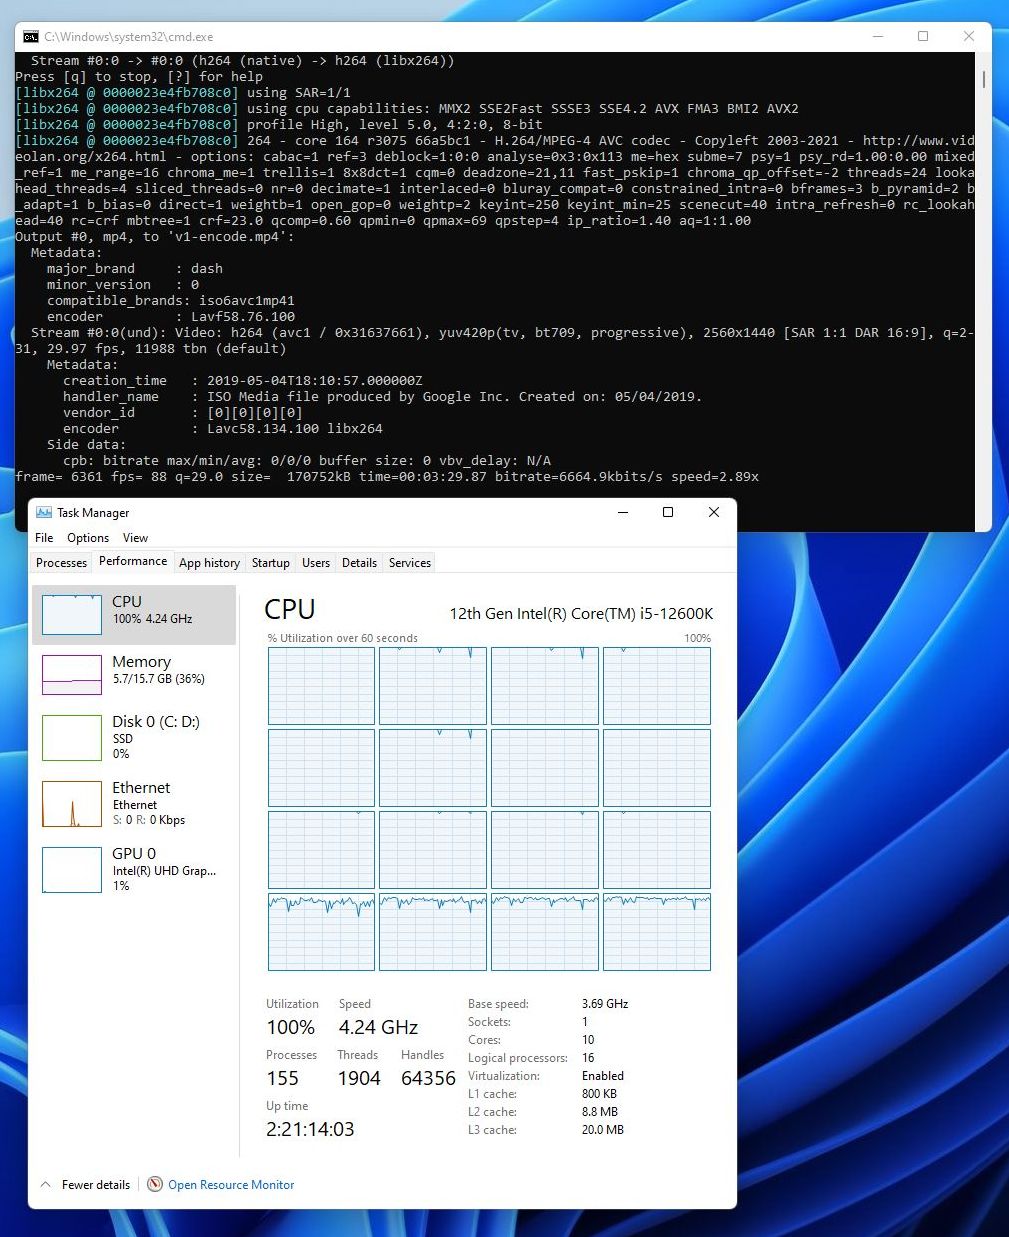
1.4 – FFmpeg Benchmark
For the last CPU test, I used FFmpeg 4.4.1 to rescale a 5min video (105MB) from 1920×1080 to 2560×1440 with the following command line:
ffmpeg -benchmark -threads 0 -i "v1.mp4" -vf scale=2560:1440:flags=lanczos -f mp4 "v1-encode.mp4"
The -benchmark option allows to print the rtime which is the elapsed time, for example:
bench: utime=2161.438s stime=5.109s rtime=310.475s
The following screenshot is interesting because it clearly shows how cores are used. The Core i5-12600K has 6 P-cores for intensive tasks. These 6 physical P-cores (performance cores or Golden Cove cores) are seen by the system as 12 logical cores. The P-cores work at 100%. The last 4 threads are the 4 E-cores (efficient cores or Gracemont cores) that are not hyper threaded and are seen by the system as 4 logical cores. E-cores don’t run at 100%. Now you understand how the total number of logical cores of the core i5-12600K is computed: 12 + 4 = 16 logical cores.
| lower is better |
| rtime: 109.413 sec – Intel Core i5-12600K – Windows 11 64-bit |
| rtime: 111.411 sec – AMD Ryzen 7 5800X – Windows 10 64-bit |
| rtime: 154.874 sec – Intel Core i5-11600K – Windows 10 64-bit |
In this test, the Core i5-12600K is +30% faster than previous gen Core i5-11600K.
2 – GPU Performance
2.1 – FurMark
FurMark is an intensive OpenGL benchmark and is perfect to quickly test the performance of the UHD Graphics 770 GPU.
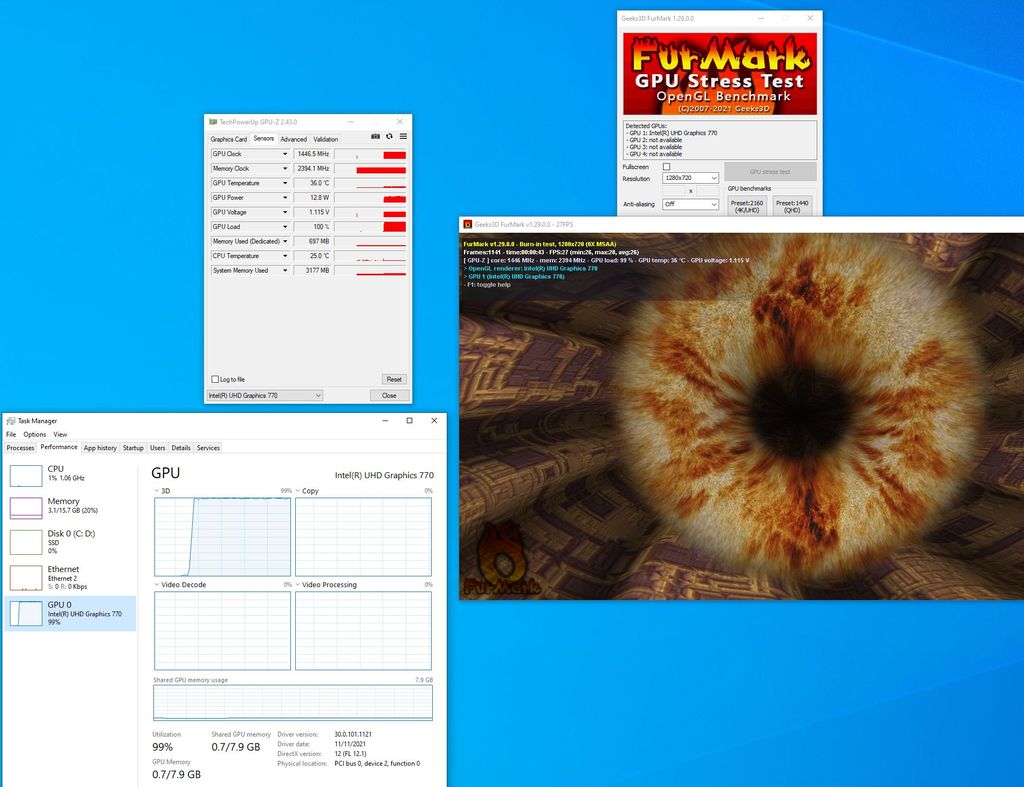
FurMark P1080 preset (1920×1080 fullscreen):
| higher is better |
| 866 points (15 FPS) – Intel Core i5-12600K, UHD Graphics 770 – Windows 11 64-bit |
| 658 points (11 FPS) – Intel Core i5-11600K, UHD Graphics 750 – Windows 10 64-bit |
According to this GPU test, the UHD Graphics 770 (Alder Lake) GPU is +30% faster than previous UHD Graphics 750 (Rocket Lake) GPU.
A test with the Rocket Lake under Windows 11 would have added a few informations worth having : the Adler Lake is tested under a different OS from the others, and as Win11 is notoriously slow un Ryzens, it would have been a great idea to see if Win11 does not have any optimization that would bias the test.
it was fixed before this was posted
like anonymous said and also Alderlake on win 10 x64 test please