Article index:
- 1 – Test Bench Components
- 1.1 – CPU: Intel Core Ultra 7 265K
- 1.2 – Motherboard: ASRock Z890 Lightning Wifi
- 1.3 – CPU Cooler: be quiet! Dark Rock 5
- 1.4 – Memory: Corsair Vengeance RGB DDR5 6000MHz
- 2 – Assembly of the Test Bench
- 3 – First Boot
- 4 – CPU Temperature Test
- 5 – CPU Benchmarks
- 5.1 – CPU-Z Benchmark
- 5.2 – 7zip Benchmark
- 5.3 – Cinebench R23
- 5.4 – CrystalMark Retro
- 5.5 – Blender Benchmark
- 5.6 – Geekbench
- 6 – GPU Benchmarks
Intel has launched its new Core Ultra 200S Arrow Lake desktop processors few weeks ago and today here is the new test bench I assembled based on the following components:
– CPU: Intel Core Ultra 7 265K
– Motherboard: ASRock Z890 Lightning Wifi
– Memory: 32GB of Corsair Vengeance RGB DDR5 6000MHz
– CPU cooler: be quiet! Dark Rock 5

1 – Test Bench Components
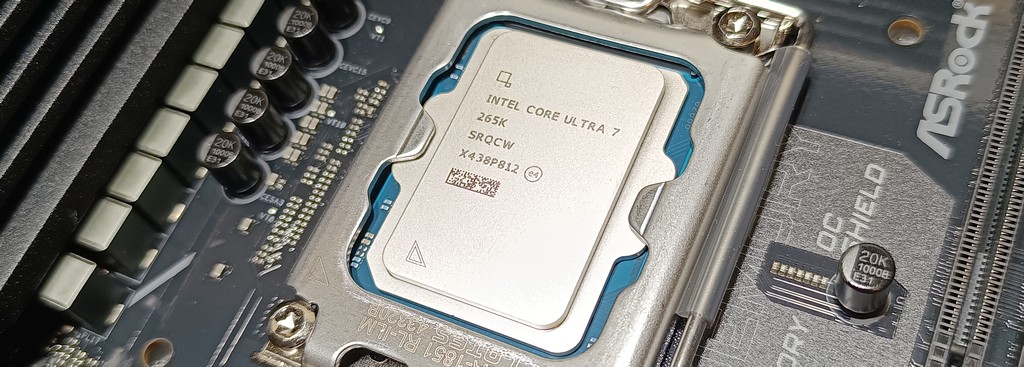
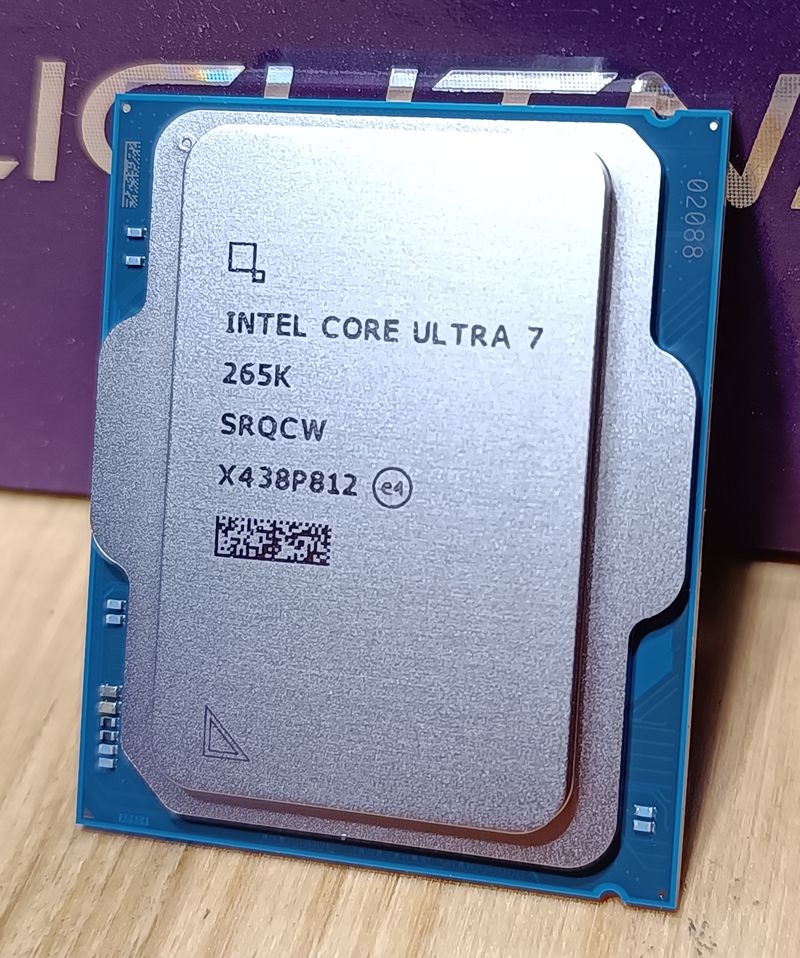
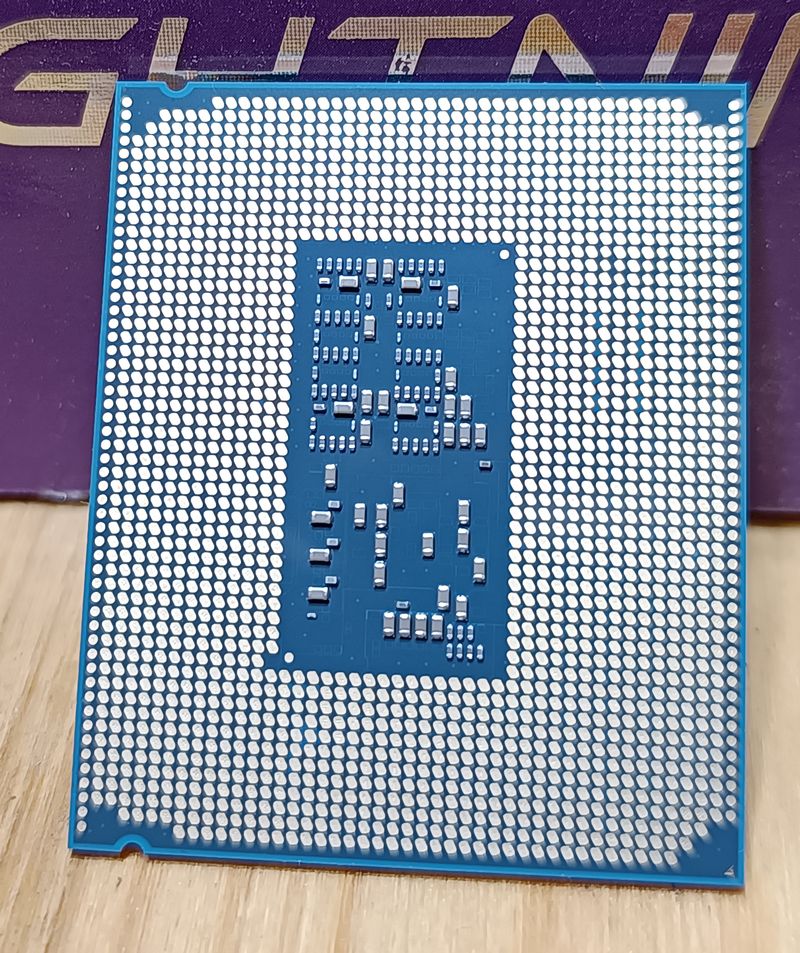
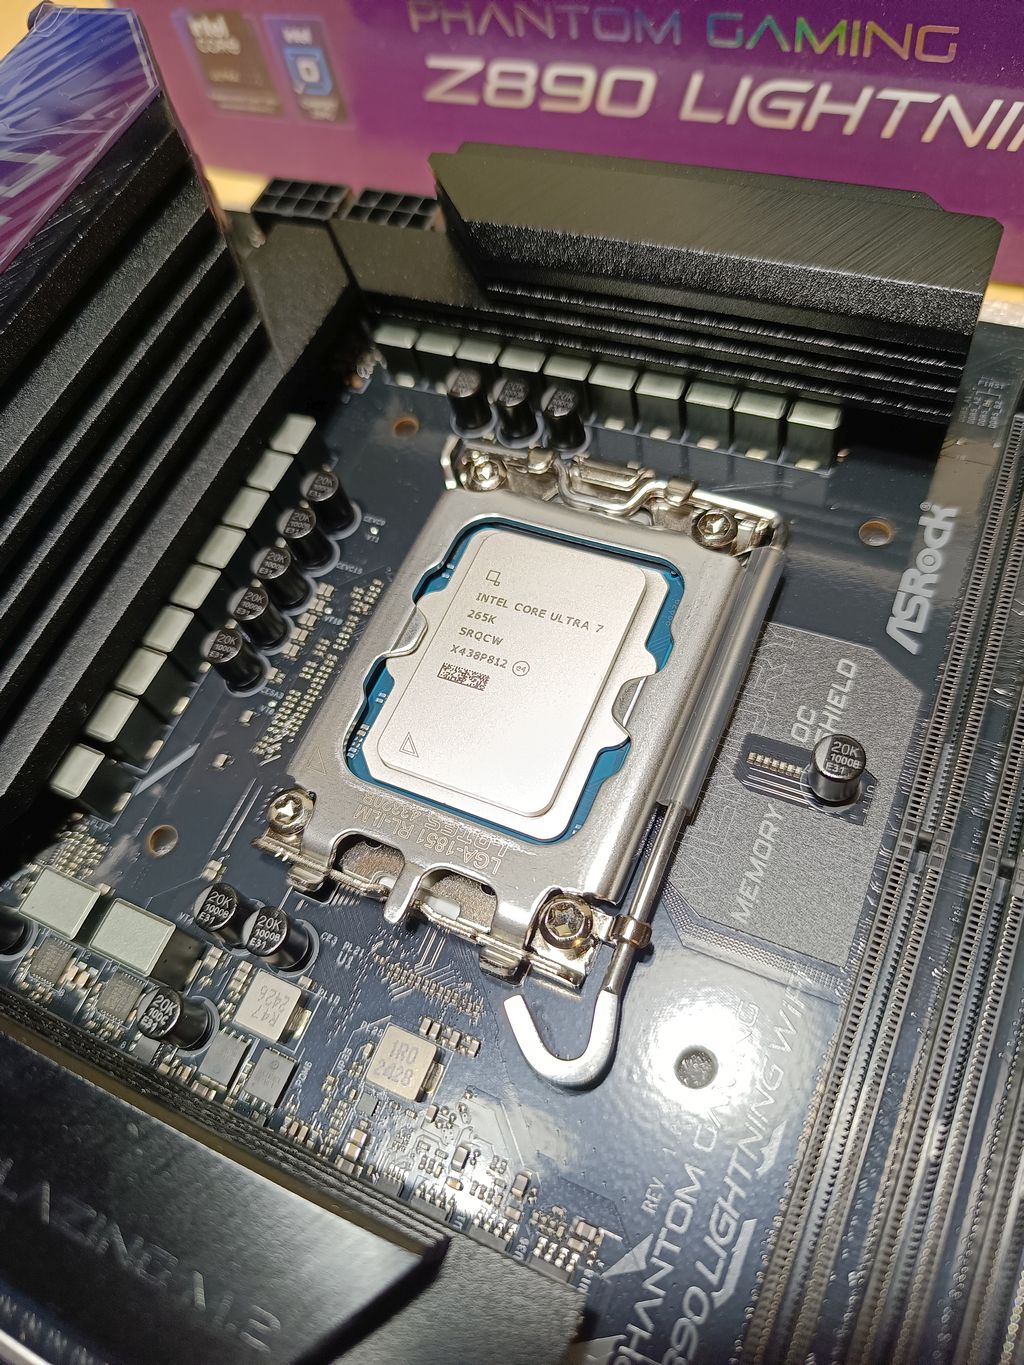
1.1 – CPU: Intel Core Ultra 7 265K
The Core Ultra 7 265K is part of the new Core Ultra 200S processor family, codenamed Arrow Lake. It’s a 3nm + 6nm processor with 8 P-cores (performance-cores), 16 E-cores (efficient-cores) for a total of 20 cores (this is what you see in Windows’ task manager). The Core Ultra 7 265K supports DDR5 memory modules and comes with the an Arc Graphics (Xe2 architecture) integrated GPU (iGPU).
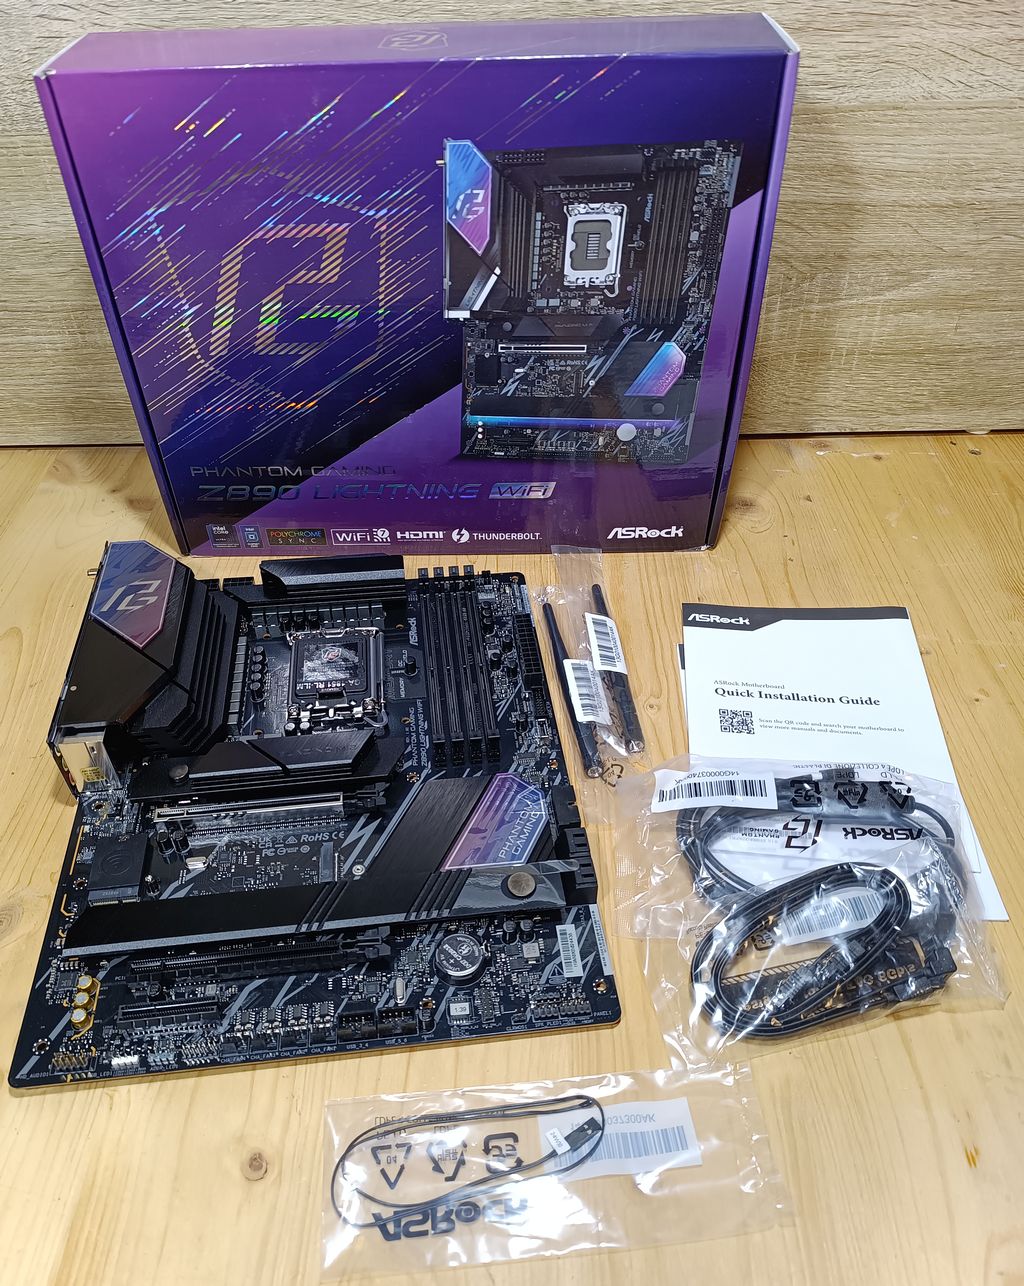
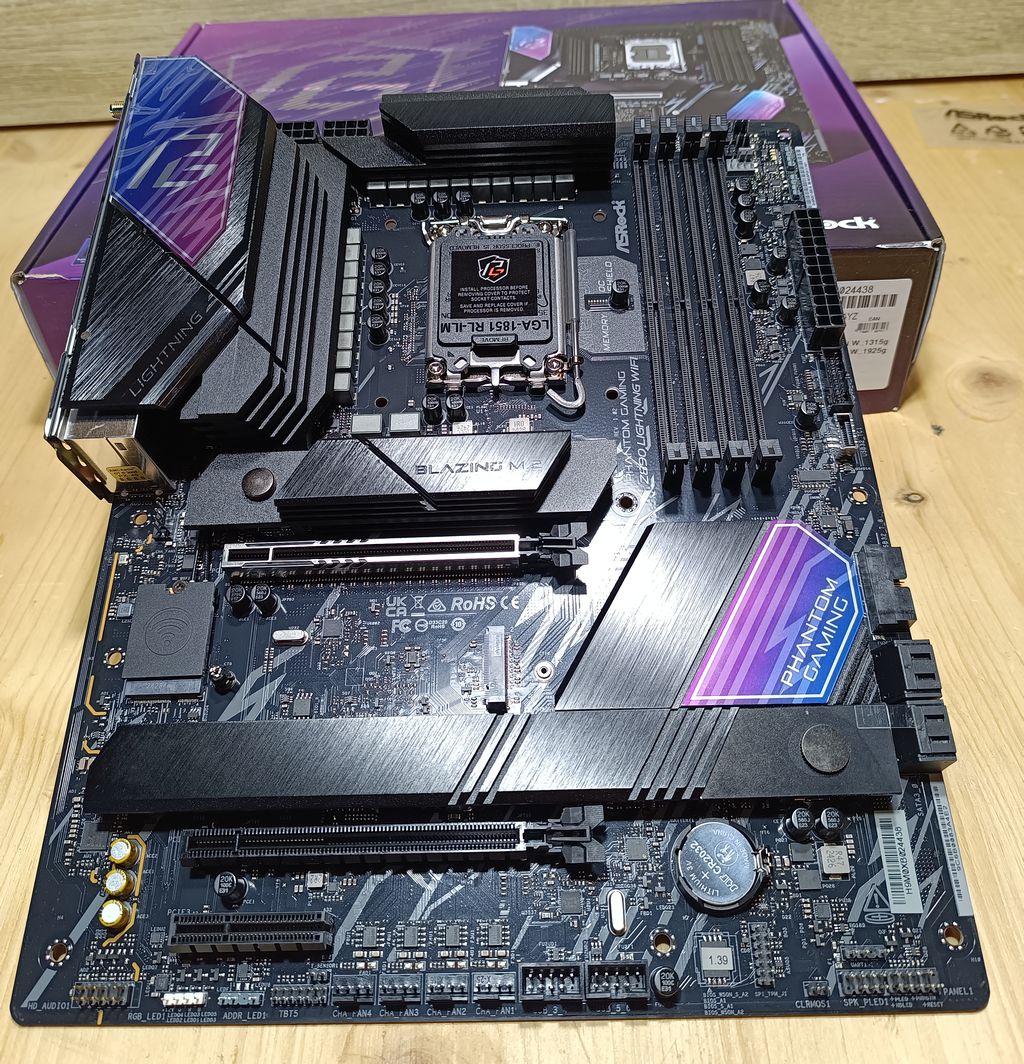
1.2 – Motherboard: ASRock Z890 Lightning Wifi
The ASRock Z890 Lightning Wifi is based on Intel’s new Z890 chipset (designed for Arrow Lake processors). Don’t expect me to test the Wifi module, I don’t use wireless network connection. I took this mainboard because it was the only choice with two PCI-e X16 slots.
Main features of the ASRock Z890 Lightning:
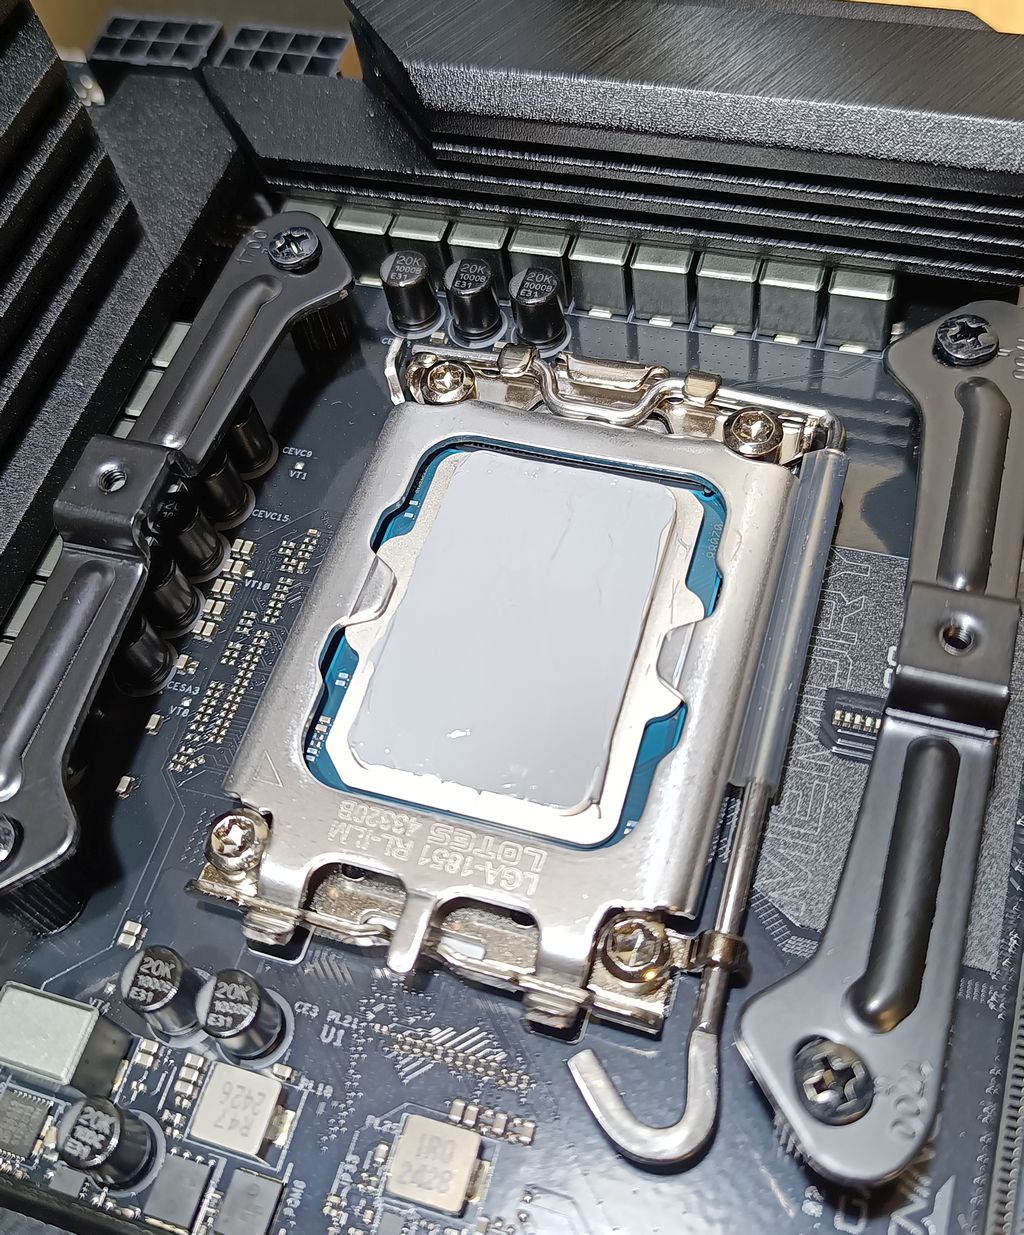
– Socket: LGA 1851 (LGA = Land Grid Array).
– Memory: 4 x DDR5 DIMM Slots
– PCIe Gen5.
– 1 x PCIe 5.0 x16 Slot (PCIE1), 1 x PCIe 4.0 x16 Slot (PCIE2) and 1 x PCIe 4.0 x4 Slot (PCIE3).
– 4 x M.2 sockets:
– 1 x Blazing M.2 socket (supports type 2280 PCIe Gen5x4 @ 128 Gb/s mode)
– 3 x Hyper M.2 socket (supports type 2280 PCIe Gen4x4 @ 64 Gb/s mode)
– 4 x SATA3 6.0 Gb/s connectors
– Video outputs: HDMI, DisplayPort
– Ethernet: 2.5Gb/s
– 2 x Thunderbolt 4 Type-C (rear)
– 1 x USB 3.2 Gen2x2 Type-C (front)
– 2 x USB 3.2 Gen2 Type-A (rear)
– 8 x USB 3.2 Gen1 (4 rear, 4 front)
– 6 x USB 2.0 (2 Rear, 4 Front)
What I like with ASRock motherboards is the BIOS update support: new BIOS images are regularly uploaded on ASRock servers. Think of it when you’ll buy your next motherboard.
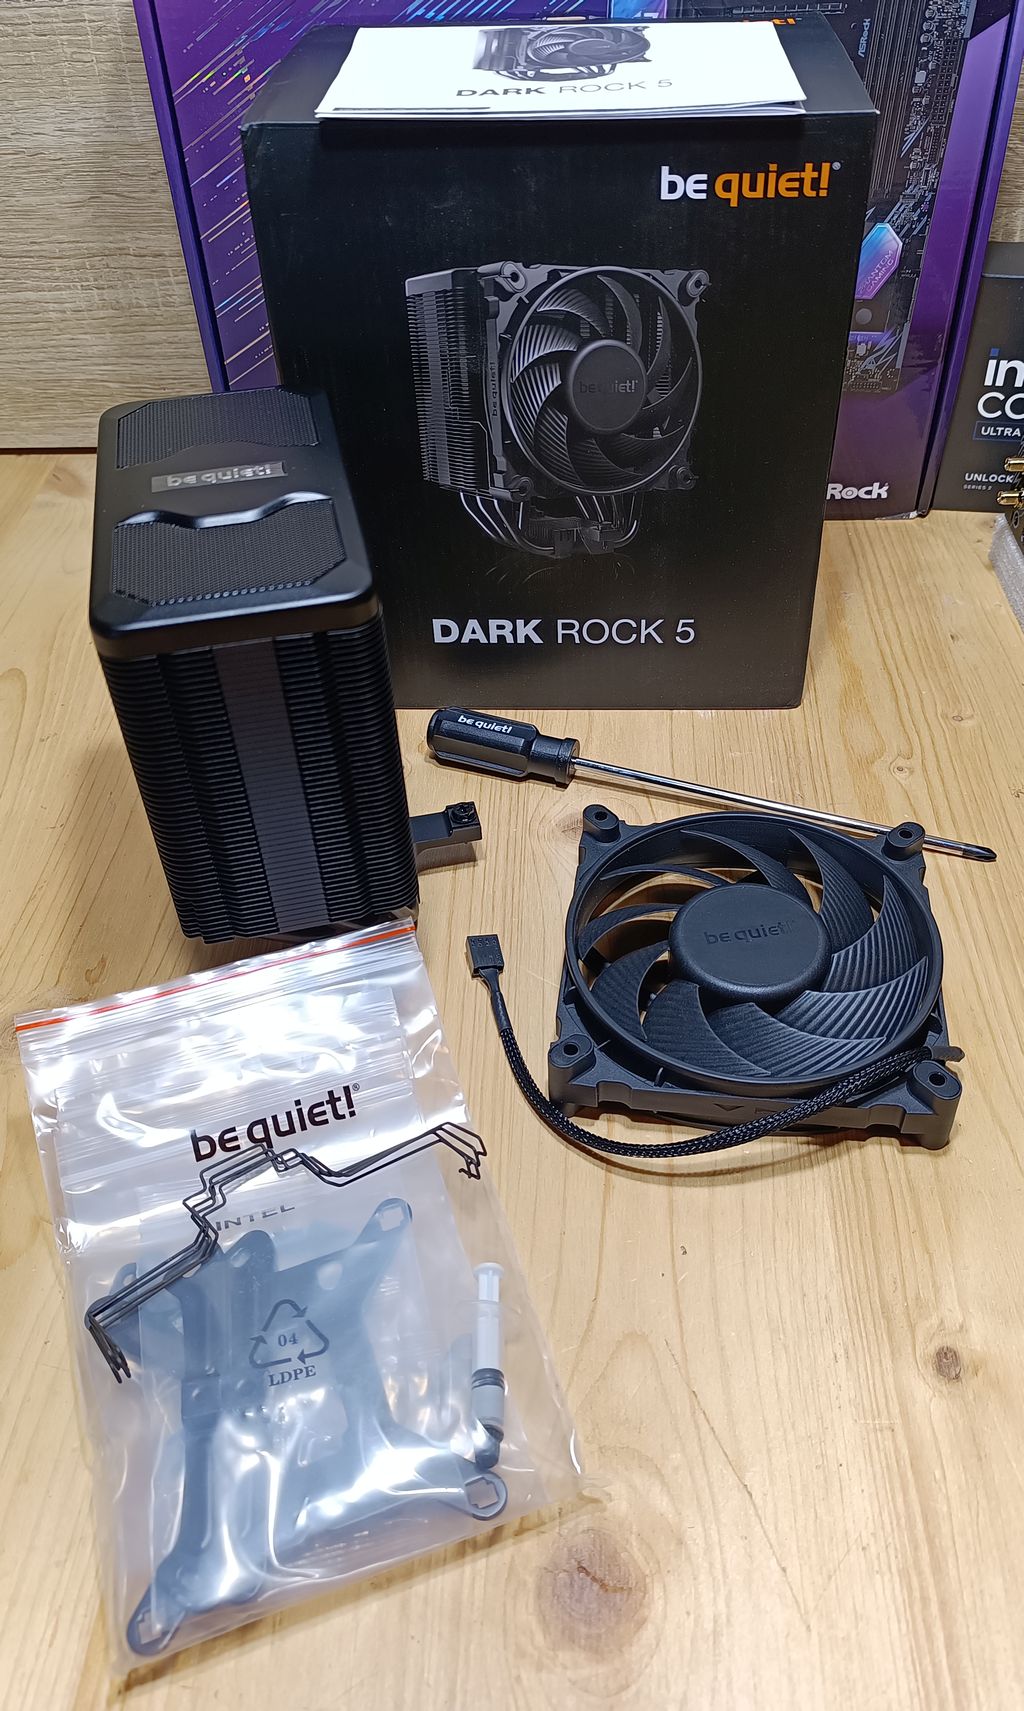
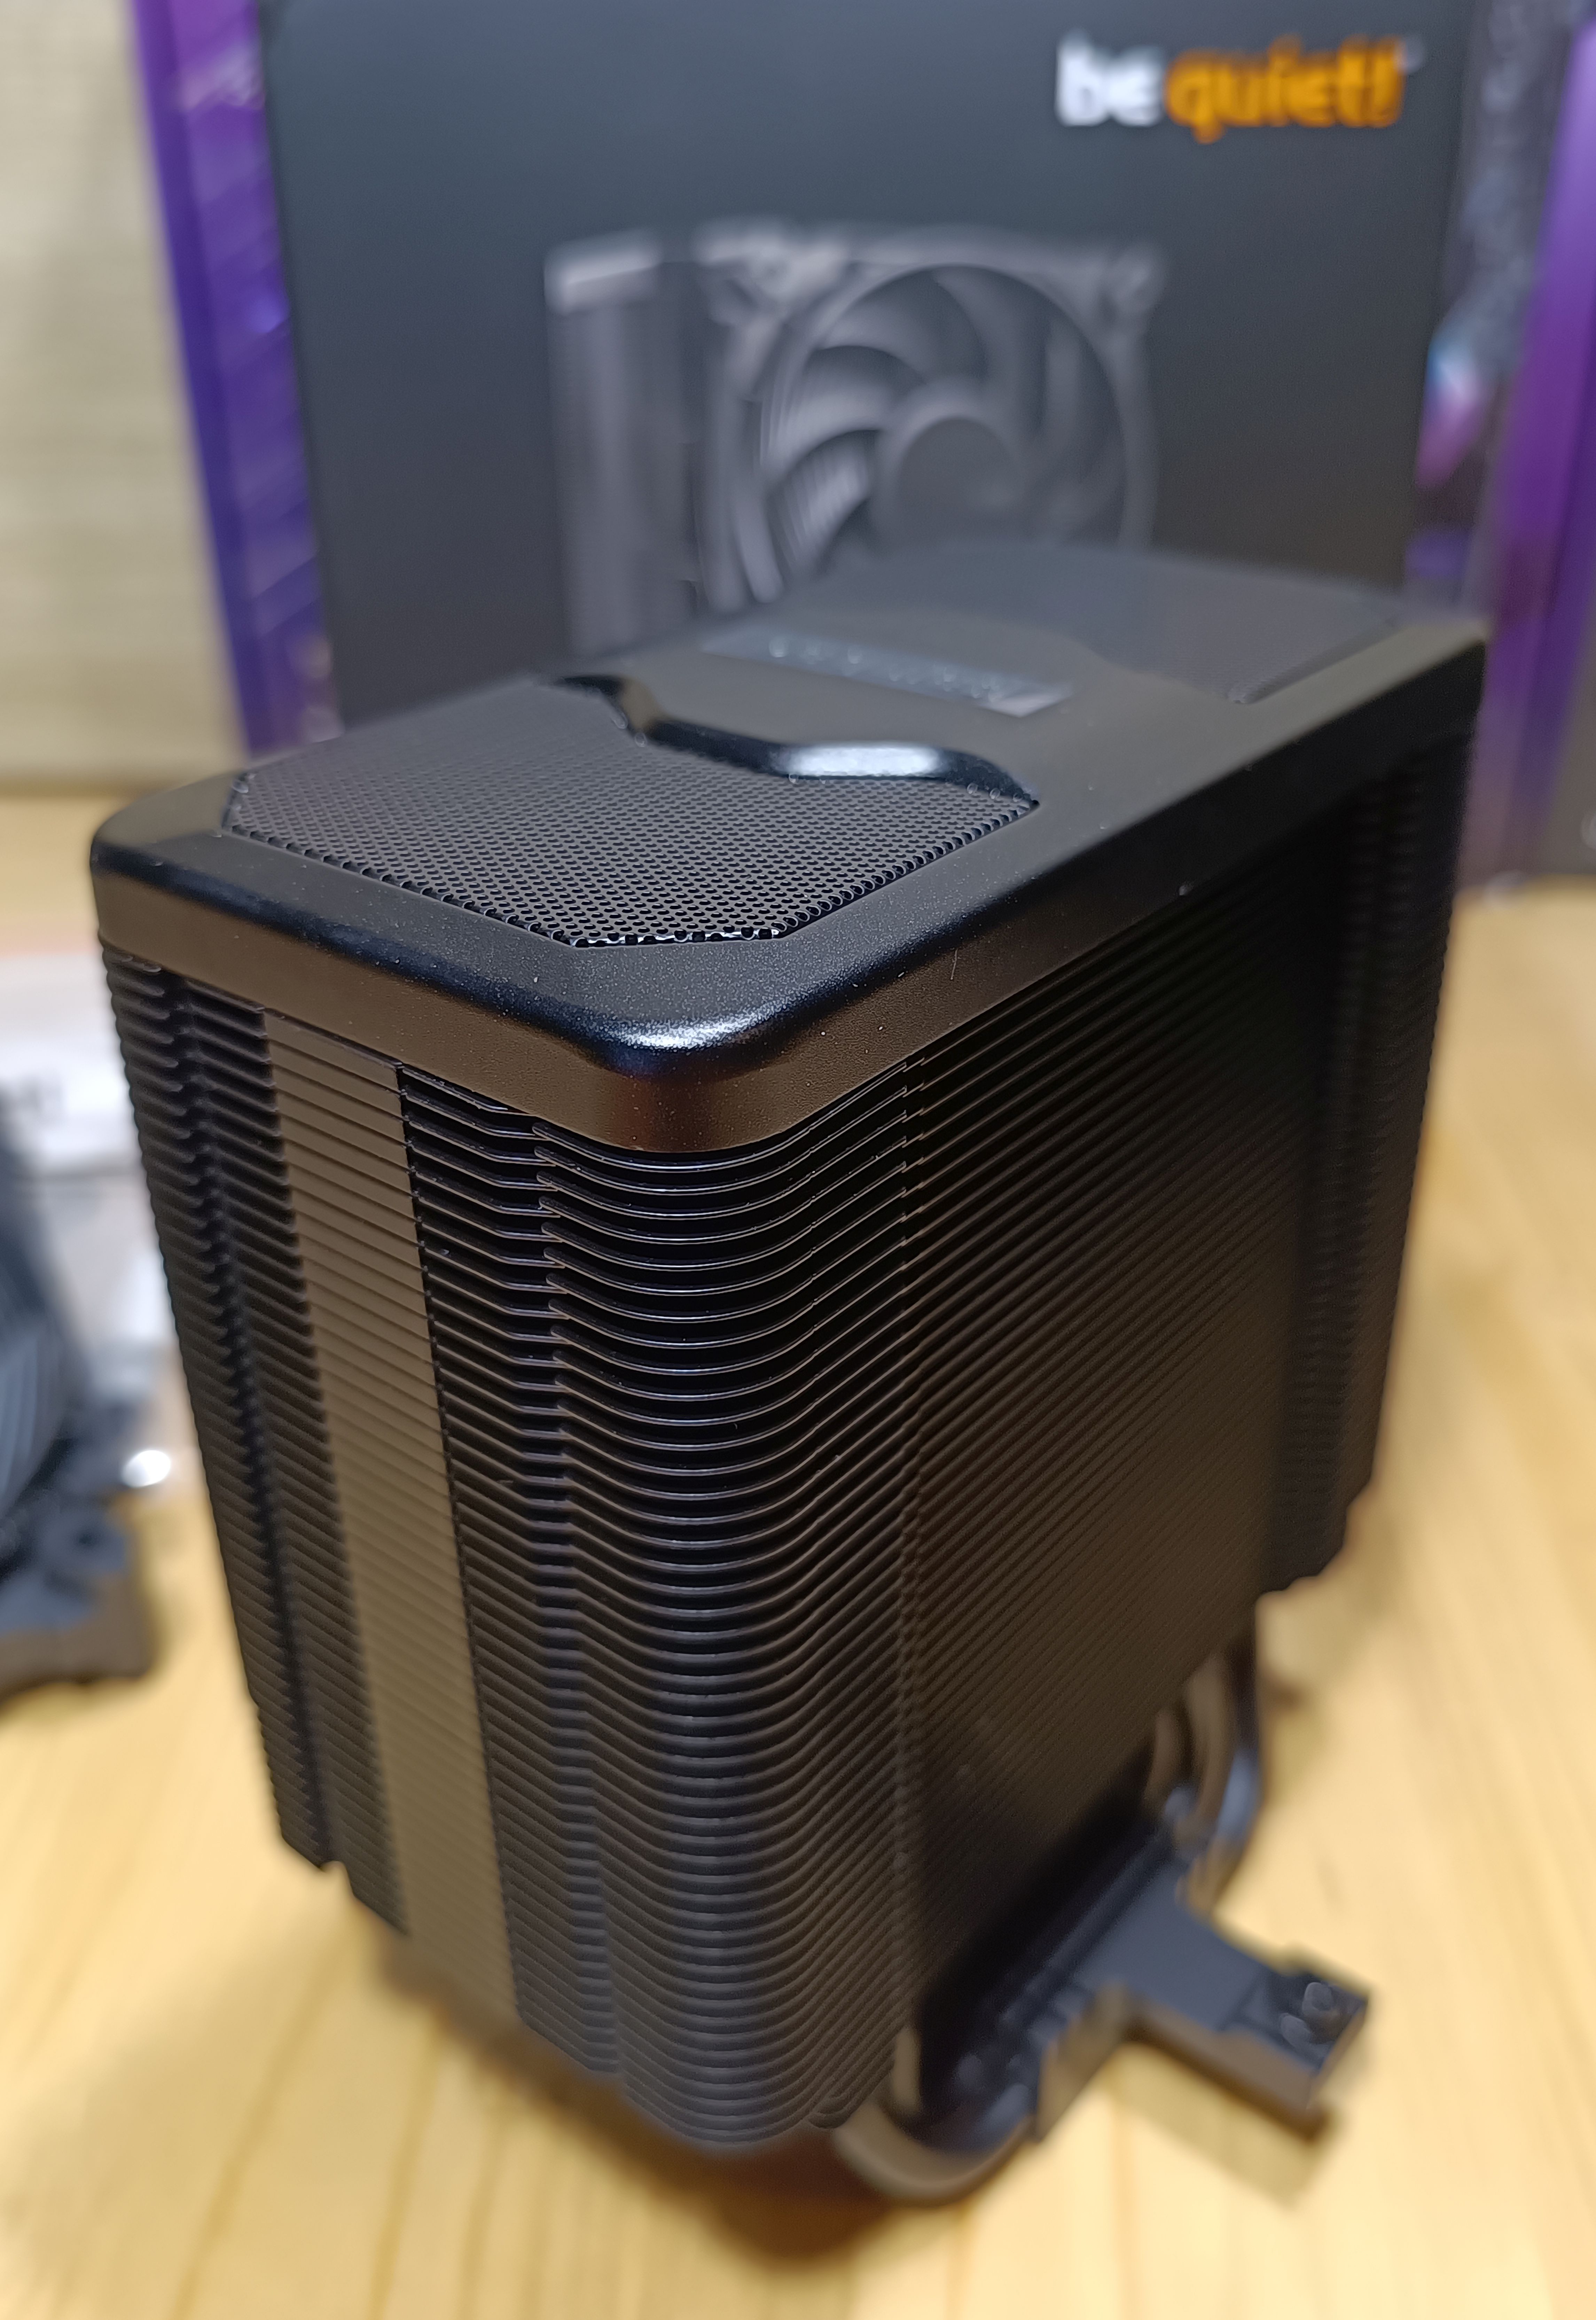
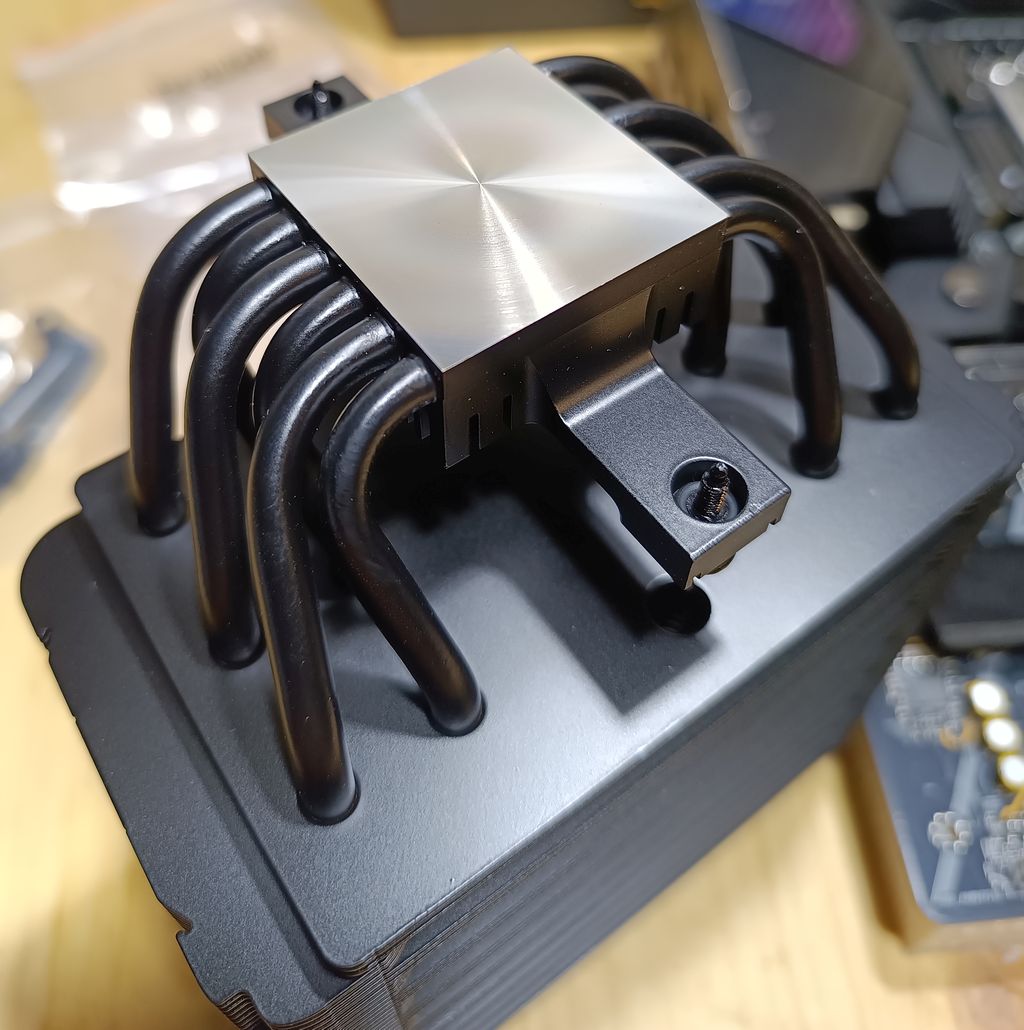
1.3 – CPU Cooler: be quiet! Dark Rock 5
The Dark Rock 5 is a cooler for latest AMD and Intel CPUs. I took this cooler because it can handle up to 210W of power dissipation. The Core Ultra 7 265K has a base power of 125W and can draw up to 250W in rare situations. So a cooler that can handle a TDP of 210W should be enough… And of course, this CPU cooler is fully compatible with the LGA 1851 socket.
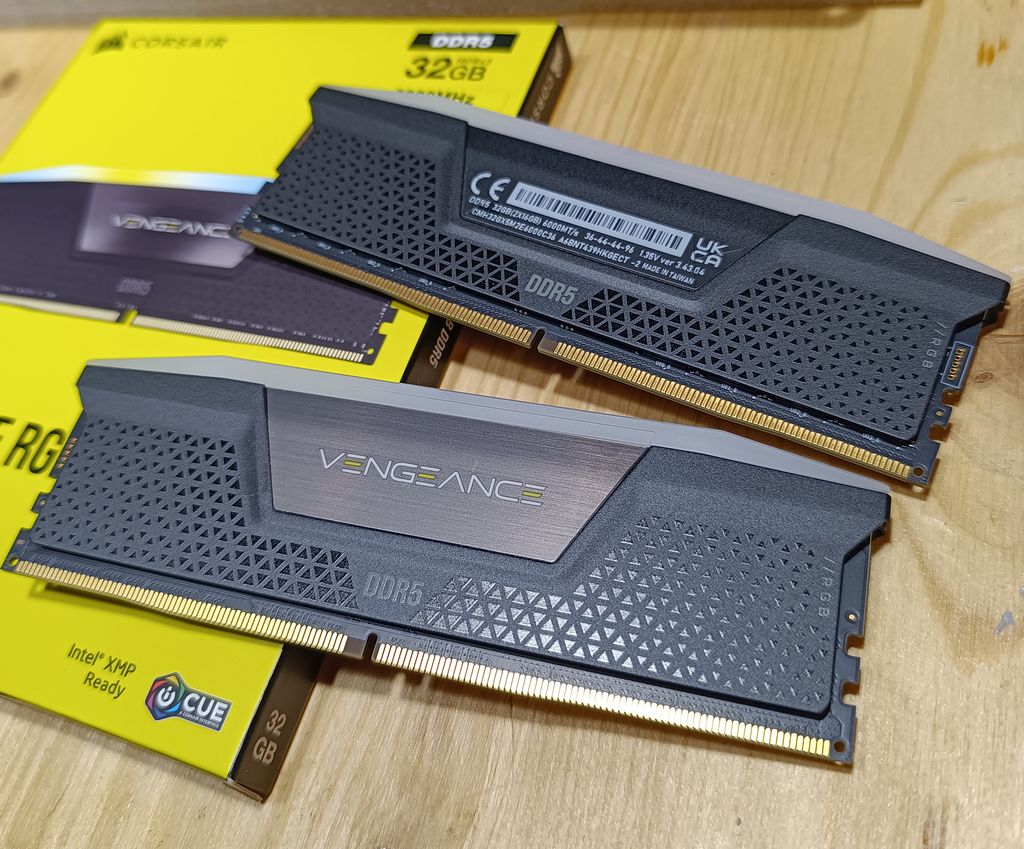
1.4 – Memory: Corsair Vengeance RGB DDR5 6000MHz
For this test bench, I chose the Corsair Vengeance RGB DDR5 made up of two modules of 16GB and clocked at 6000MHz (don’t forget to enable the XMP profile in the BIOS to enjoy the 6000MHz otherwise your memory will run at 4800MHz).
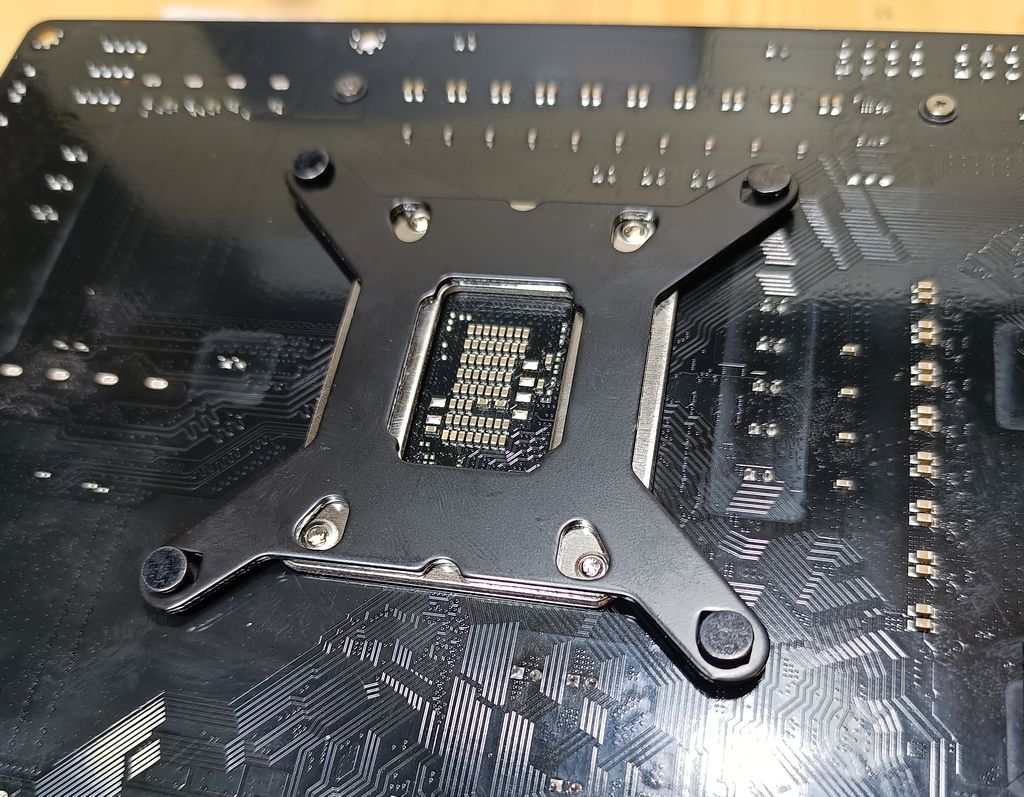
2 – Assembly of the Test Bench
The CPU cooler backplate:
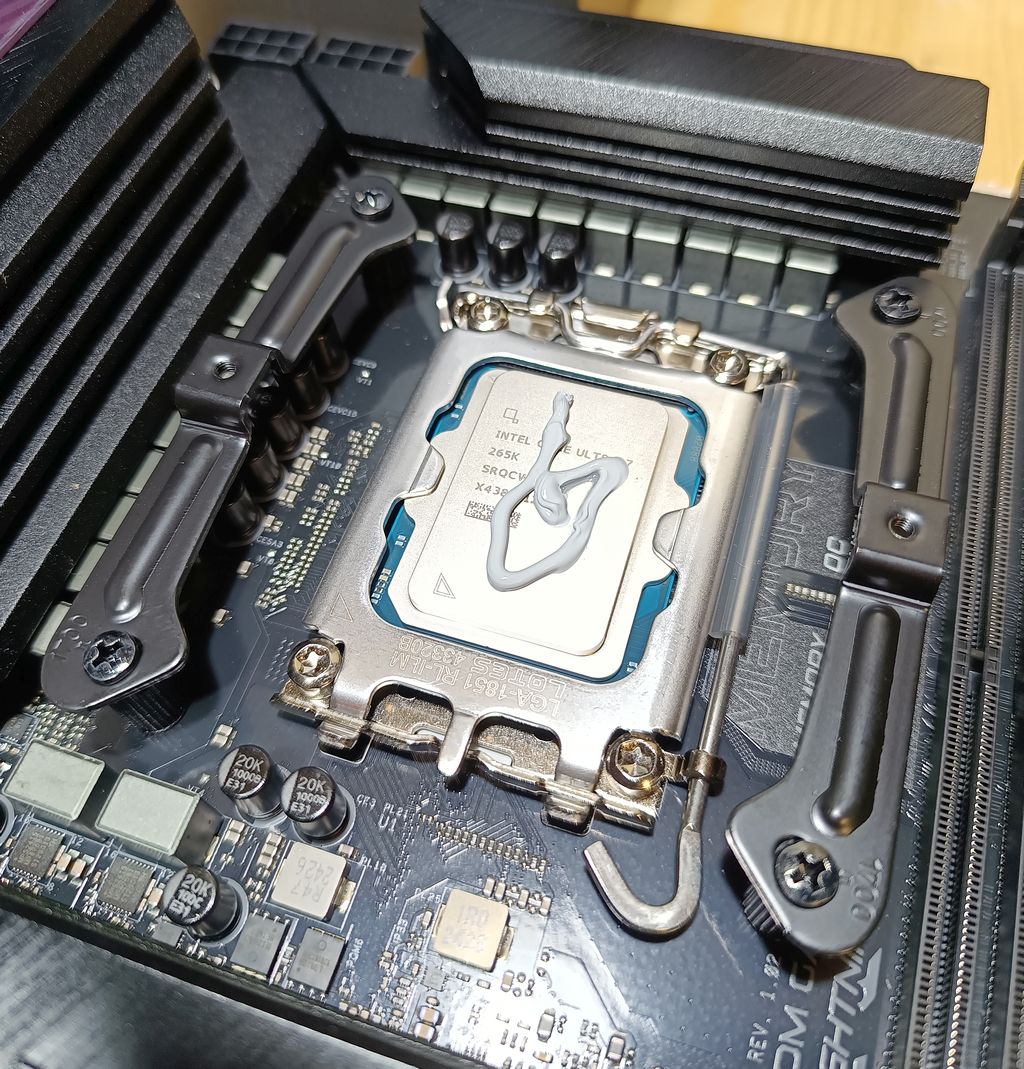
The CPU cooler mounting brackets and thermal paste on the CPU:
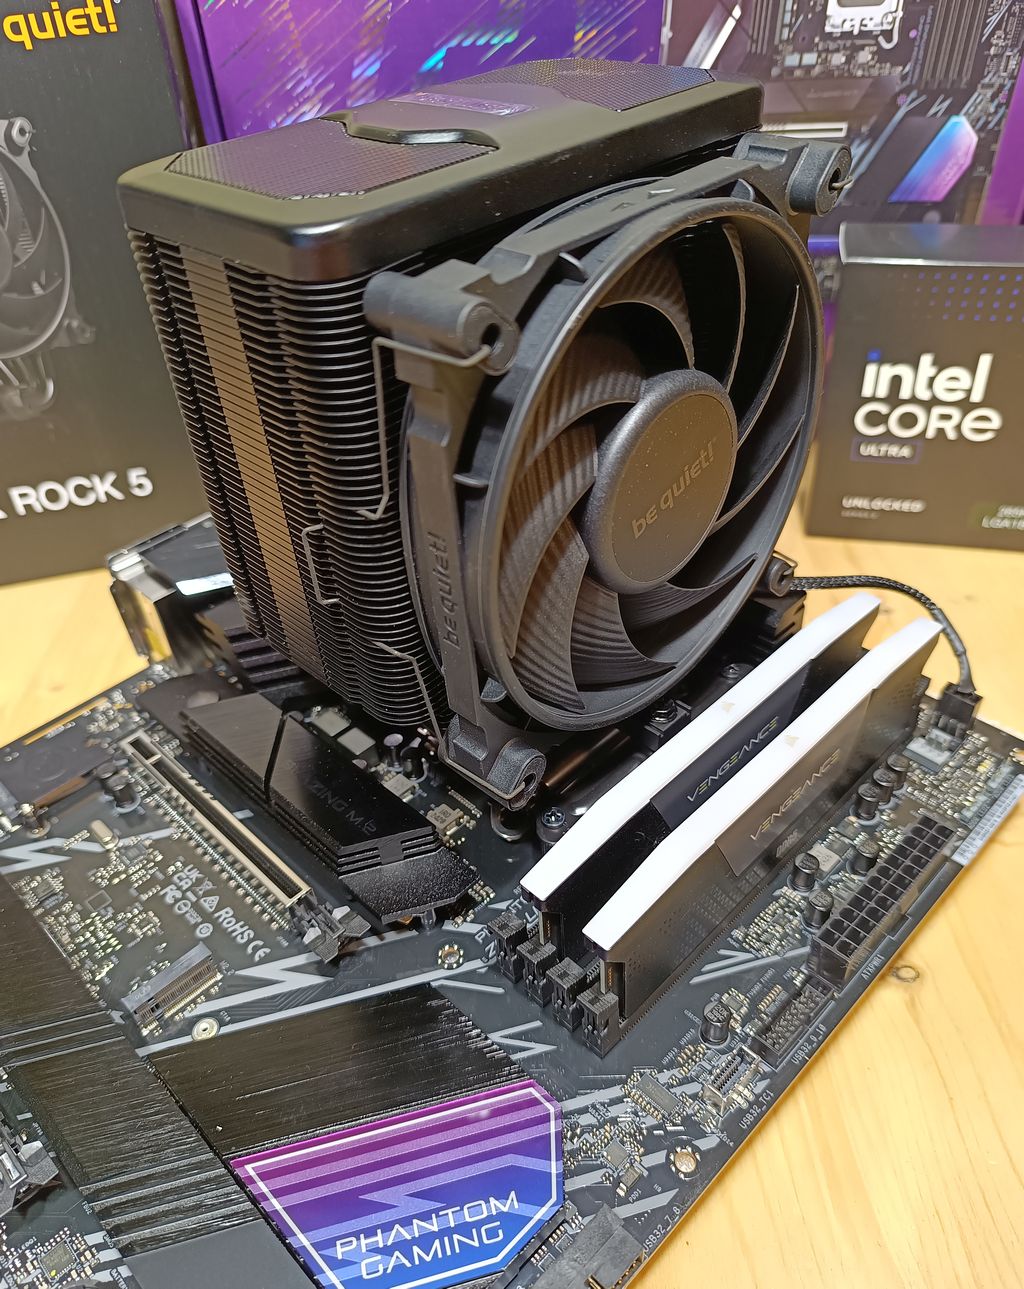
Mounting of the Dark Rock 5 heatsink using the screwdriver provided by be quiet!


Assembly done!
3 – First Boot
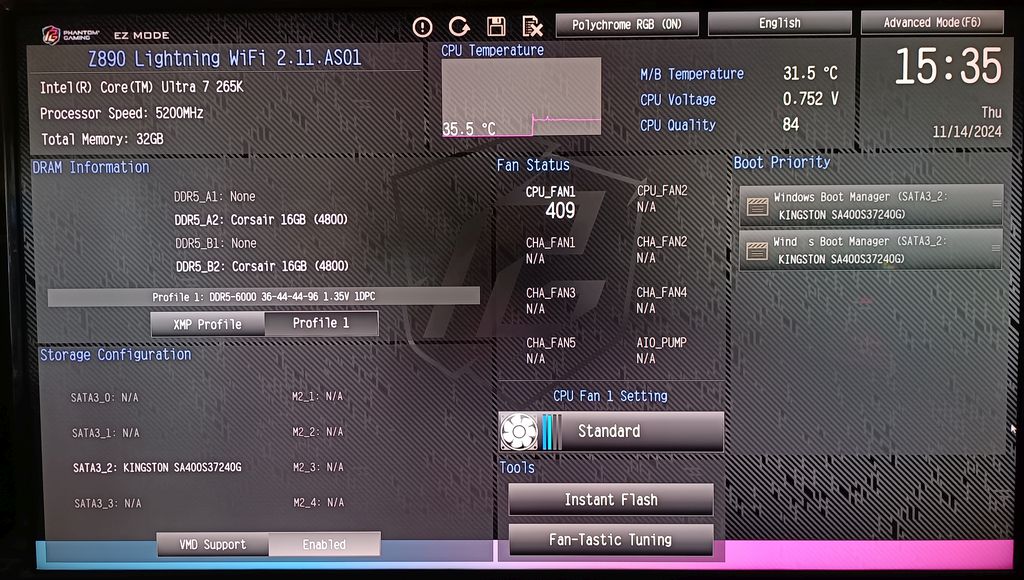
The motherboard is shipped with the v1.39 BIOS. At the time of writing, the latest BIOS is v2.11.AS01 beta. I put this bios image on a USB key, started the test bench and updated the BIOS using the Instant Flash utility. The update process worked flawlessly. Few minutes later:
As for any other piece of software, it’s recommended to update a BIOS to get new features but mainly to fix bugs!
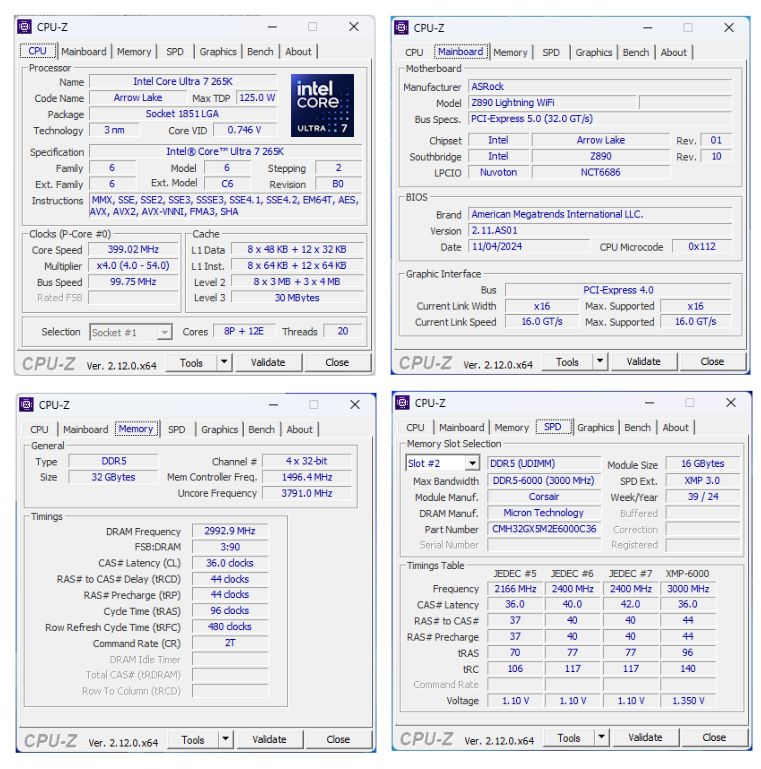
3.1 – CPU-Z data
4 – CPU Temperature Test
In the BIOS, we saw that the temperature of the CPU was 35°C. Let’s check the temperature on Windows at idle and under load.
4.1 – Idle temperature
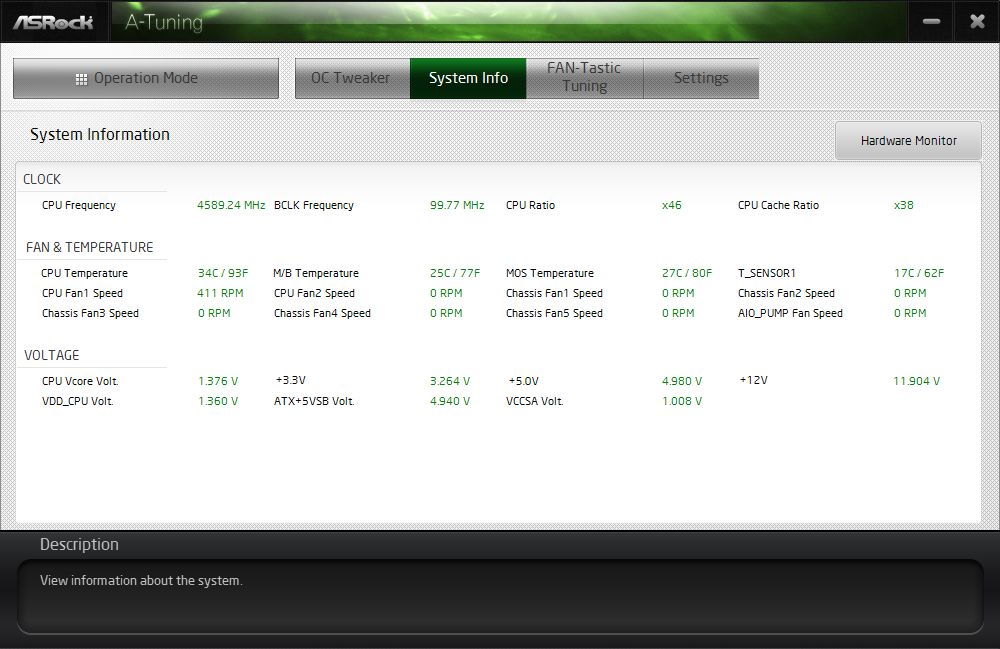
4.1.1 – ASRock A-Tuning
– CPU: 34°C
4.1.2 – HWiNFO 8.14 and HWMonitor 1.55
– HWiNFO download
– HWMonitor download
– CPU package: 35-37°C
– CPU package power: 7W

4.2 – Stress Test temperature
To get an overview of the CPU temperature under load, I stressed the CPU with three utilites:
1/ Cinebench R24
2/ CPU-Z CPU stress test
3/ FurMark2 CPU Burner
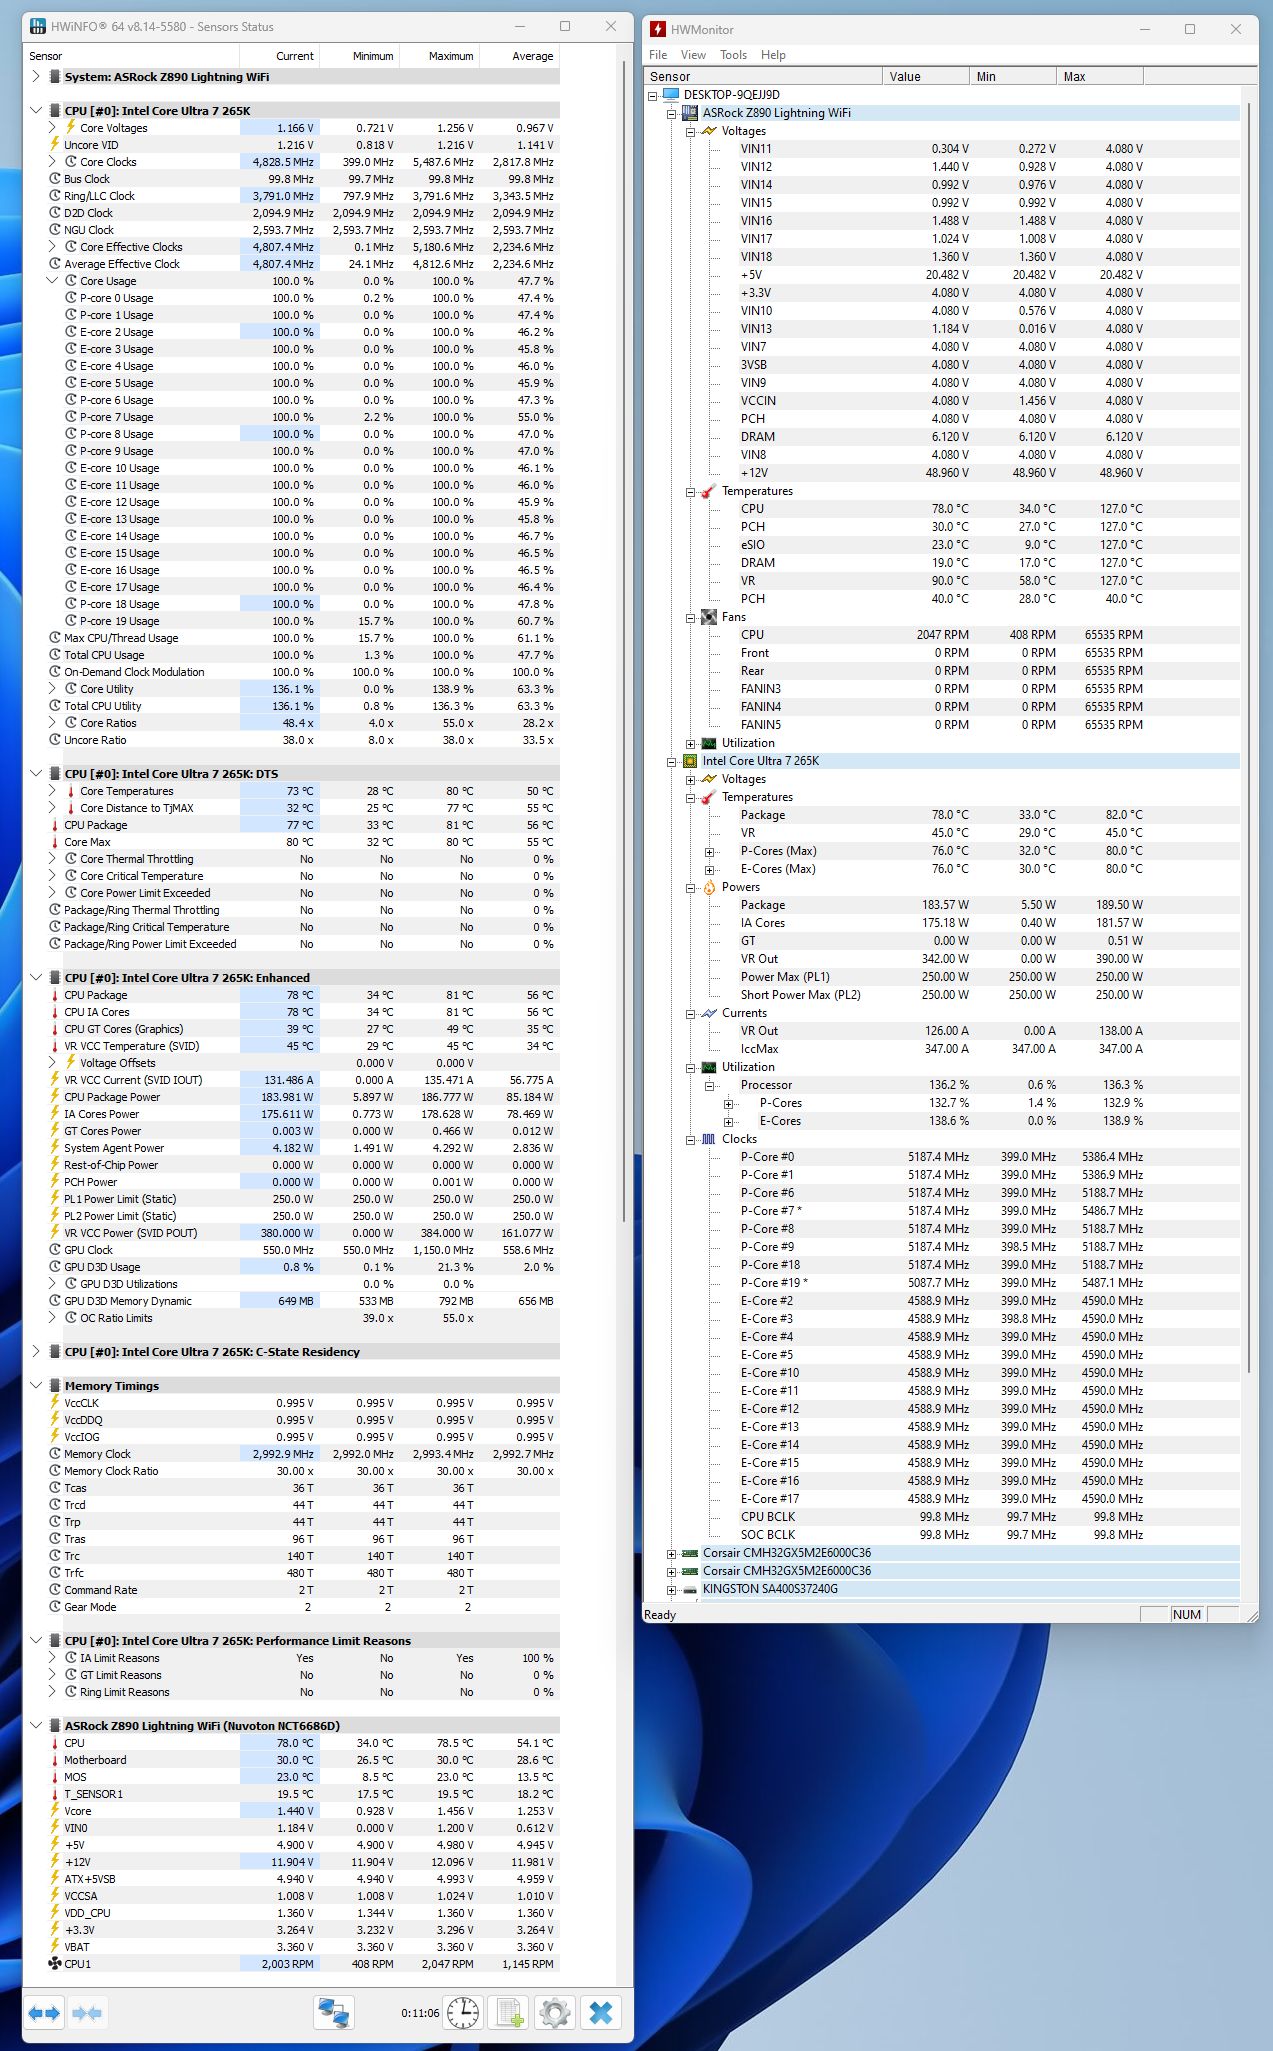
4.2.1 – Cinebench R24
– CPU package: 78°C
– CPU package power: 183W

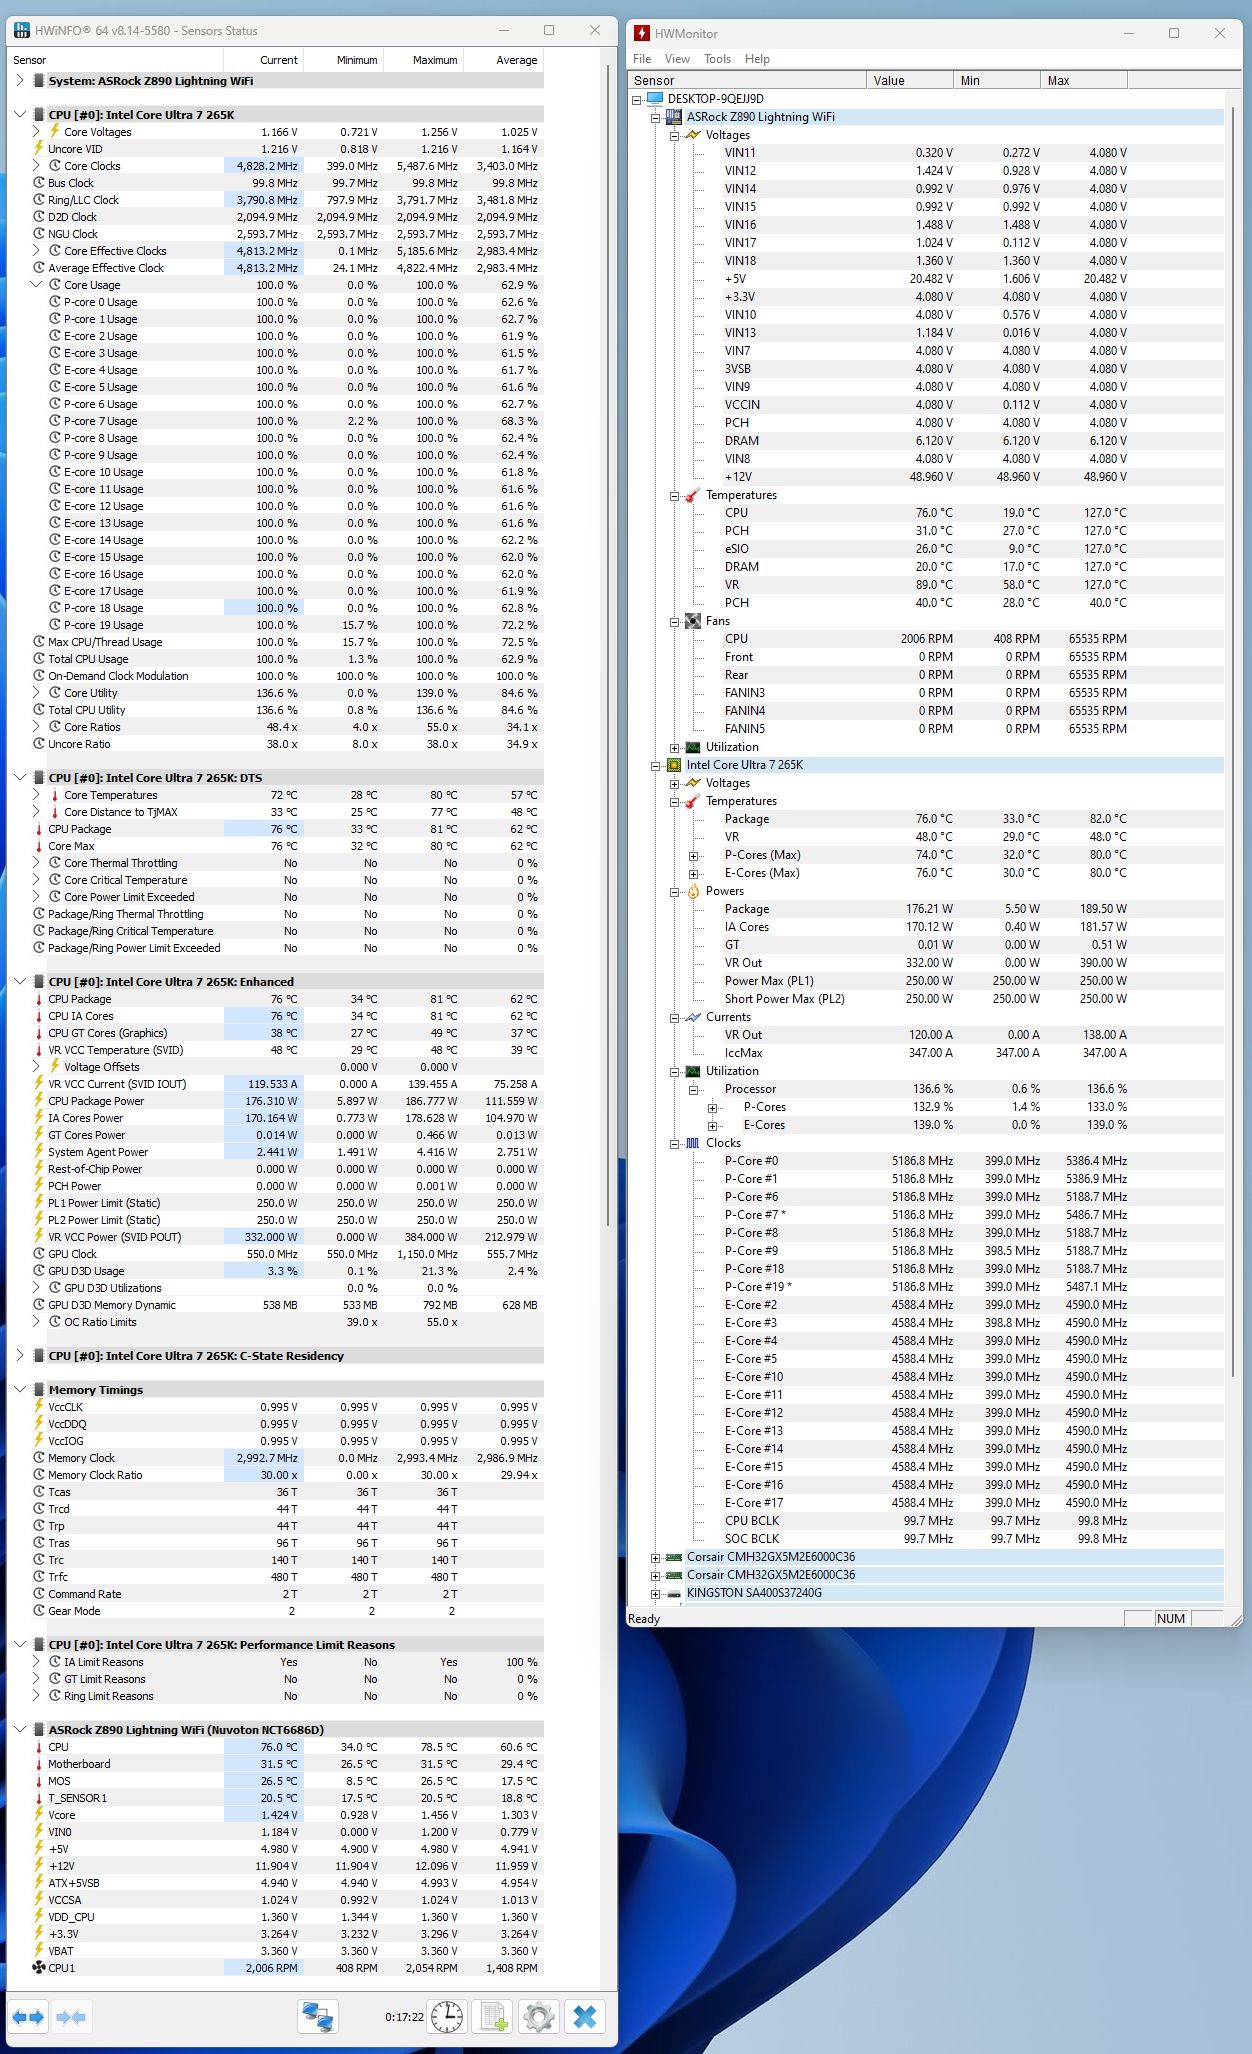
4.2.2 – CPU-Z CPU stress test
– CPU package: 76°C
– CPU package power: 176W

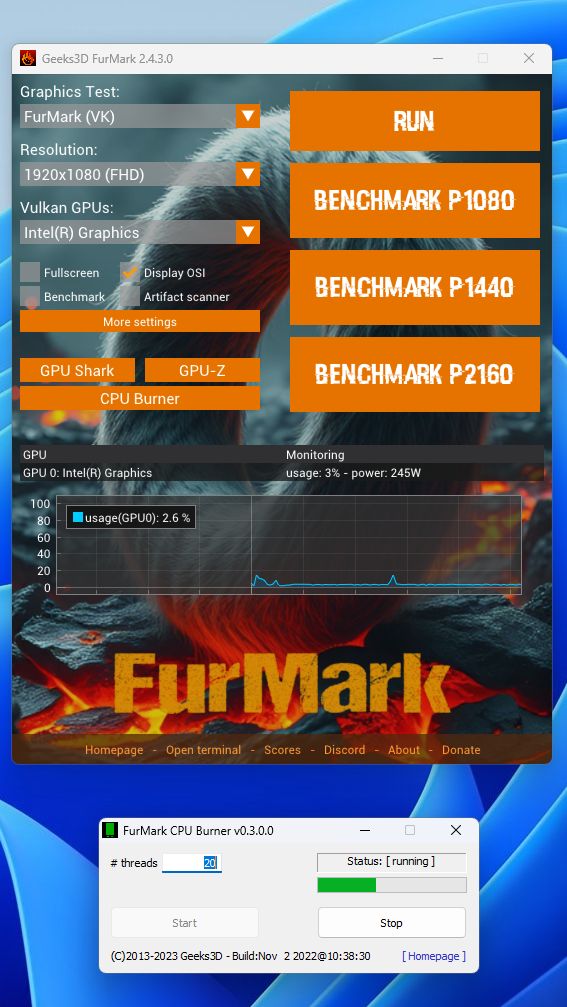
4.2.3 – FurMark2 CPU Burner
– CPU package: 104°C
– CPU package power: 248W
Ouch! I don’t know what I coded in this CPU burner, but it seems to push the CPU in its limits!
Maybe I need a bigger CPU cooler for this processor…

5 – CPU Benchmarks
For reference, I added the scores of an Intel Core i5-13600K (the CPU in my workstation). This processor has 14 physical cores and 20 logical cores (or threads).
5.1 – CPU-Z Benchmark
CPU-Z has a single and multithread CPU benchmark in the Bench panel.

5.1.1 – Single threaded test
| higher is better |
| 884 – Intel Core Ultra 7 265K – Windows 11 64-bit |
| 831 – Intel Core i5-13600K – Windows 10 64-bit |
5.1.2 – Multi-threaded test
| higher is better |
| 15803 – Intel Core Ultra 7 265K – Windows 11 64-bit |
| 9689 – Intel Core i5-13600K – Windows 10 64-bit |
5.2 – 7zip Benchmark
The popular archive file utility 7-Zip comes with a built-in CPU benchmark module. To run the benchmark, start 7-Zip main interface, then launch Tools > Benchmark. In this benchmark, 7-Zip compresses and decompresses dummy data and shows the score in number of million (or giga) instructions per second (MIPS for older CPUs and GIPS for recent CPUs).
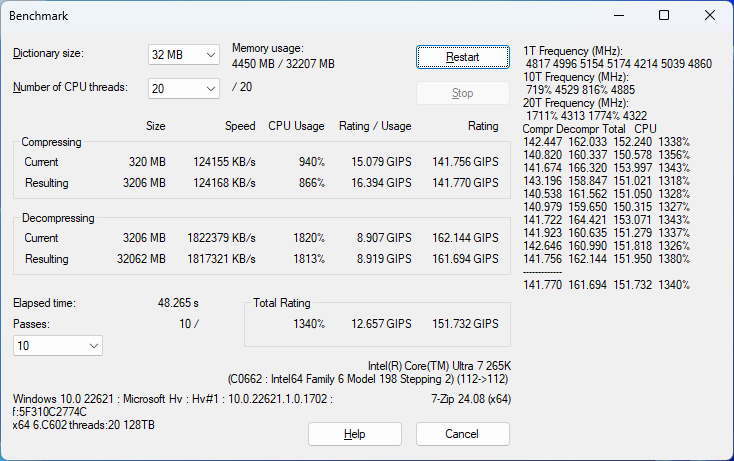
| higher is better |
| 151 GIPS – Intel Core Ultra 7 265K – Windows 11 64-bit |
| 121 GIPS – Intel Core i5-13600K – Windows 10 64-bit |
5.3 – Cinebench R23
Cinebench R23 is CPU benchmark based on Cinema4D. Cinebench offers single and multi-threaded CPU benchmark.
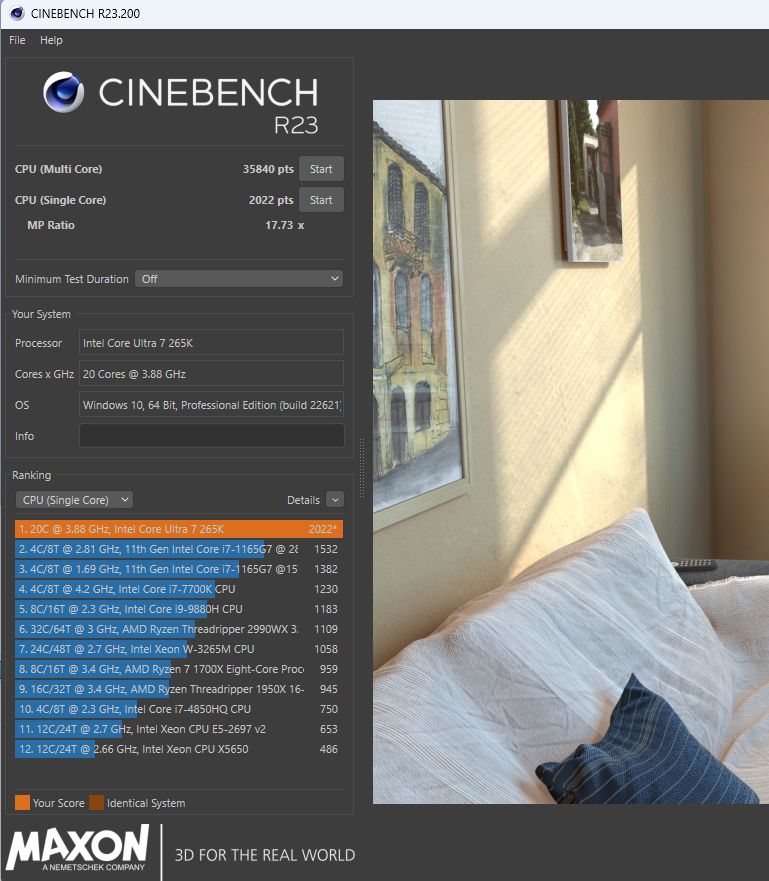
5.3.1 – Single threaded test
| higher is better |
| 2022 points – Intel Core Ultra 7 265K – Windows 11 64-bit |
| 1904 points – Intel Core i5-13600K – Windows 10 64-bit |
5.3.2 – Multi-threaded test
| higher is better |
| 35840 points – Intel Core Ultra 7 265K – Windows 11 64-bit |
| 21908 points – Intel Core i5-13600K – Windows 10 64-bit |
5.4 – CrystalMark Retro
CrystalMark Retro is a benchmarking utility that measures CPU, disk, 2D graphics (GDI), and 3D graphics (OpenGL) performance. For this article, only the CPU test is interesting.
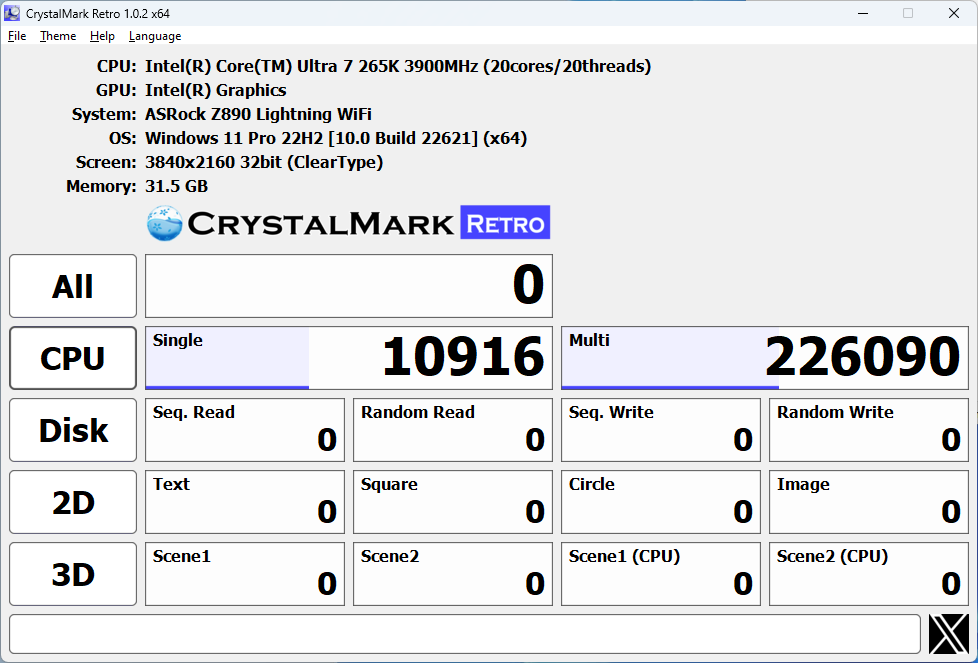
5.3.1 – Single threaded test
| higher is better |
| 12767 points – Intel Core i5-13600K – Windows 10 64-bit |
| 10916 points – Intel Core Ultra 7 265K – Windows 11 64-bit |
5.3.2 – Multi-threaded test
| higher is better |
| 226090 points – Intel Core Ultra 7 265K – Windows 11 64-bit |
| 167924 points – Intel Core i5-13600K – Windows 10 64-bit |
5.5 – Blender Benchmark
Blender Benchmark is a benchmarking tool based on the Blender Cycle engine. The Blender benchmark Score is a measure of how quickly Cycles can render path tracing samples on one CPU or GPU device. The higher the number, the better. In particular it’s the estimated number of samples per minute, summed for all benchmark scenes.

Monster test:
| higher is better |
| 217 samples/min – Intel Core Ultra 7 265K – Windows 11 64-bit |
| 130 samples/min – Intel Core i5-13600K – Windows 10 64-bit |
5.6 – Geekbench
Geekbench is a benchmarking tool that measures your system’s performance: CPU, Computing (CUDA, OpenCL) and graphics (Vulkan, Metal). We will use the CPU test only.

5.6.1 – Single threaded test
| higher is better |
| 2892 – Intel Core Ultra 7 265K – Windows 11 64-bit |
| 1766 – Intel Core i5-13600K – Windows 10 64-bit |
5.6.2 – Multi-threaded test
| higher is better |
| 19946 – Intel Core Ultra 7 265K – Windows 11 64-bit |
| 11259 – Intel Core i5-13600K – Windows 10 64-bit |
6 – GPU Benchmarks
Graphics driver used for GPU tests: v6297.
6.1 – FurMark 2.4
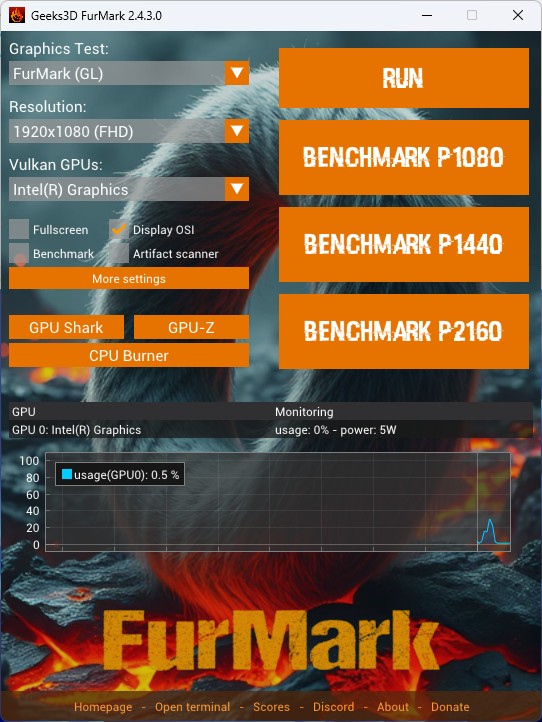
6.1.1 – FurMark(GL) P1080
| higher is better |
| 1659 (27 FPS) – Arc Graphics (Intel Core Ultra 7 265K) – Windows 11 64-bit |
| 866 (15 FPS) – UHD Graphics 770 (Intel Core i5-13600K) – Windows 10 64-bit |