Article index:
1 – Overview
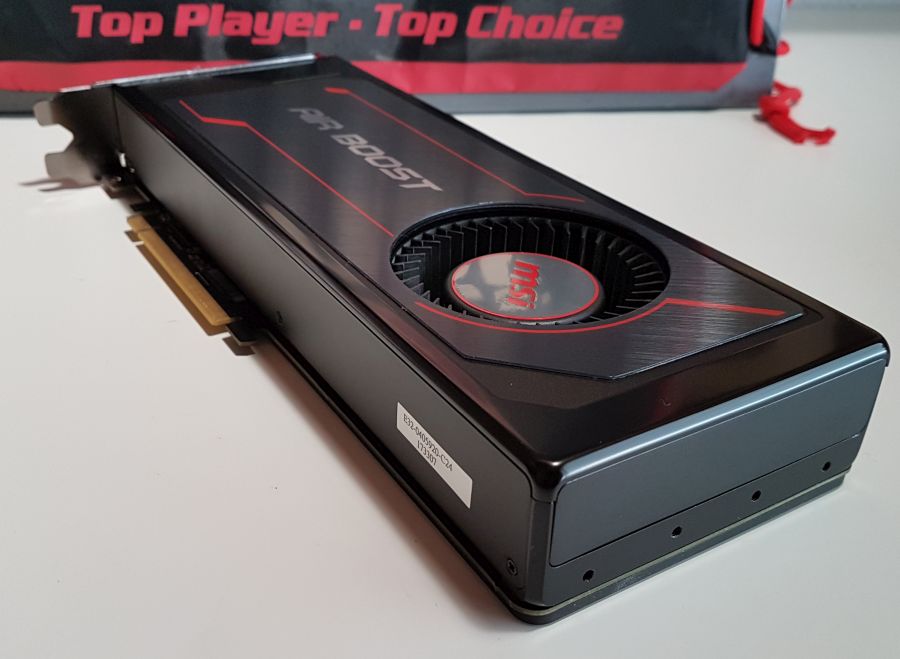
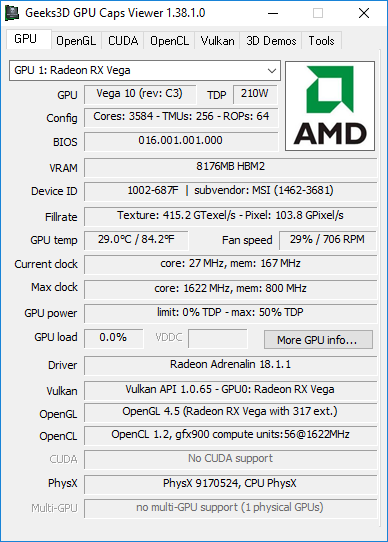
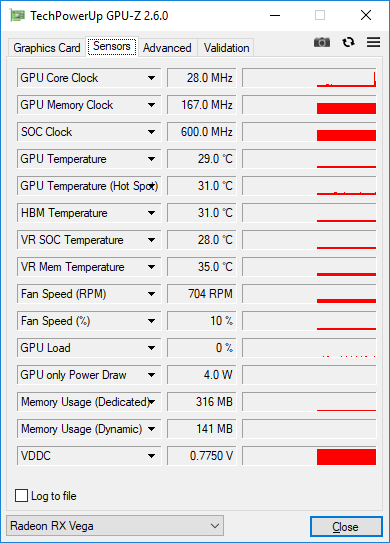
MSI Radeon RX Vega 56 AIR BOOST is based on a factory-overclocked RX Vega 56 GPU (Vega 10) with a boost clock speed of 1520MHz (the reference RX Vega 56 has a boost clock of 1471MHz). With both GPU Caps Viewer 1.38 and GPU-Z, the boost clock of this sample is higher: 1622MHz. The RX Vega 56 features 3584 shader cores (56 compute units), 224 texture units and 64 ROPs.
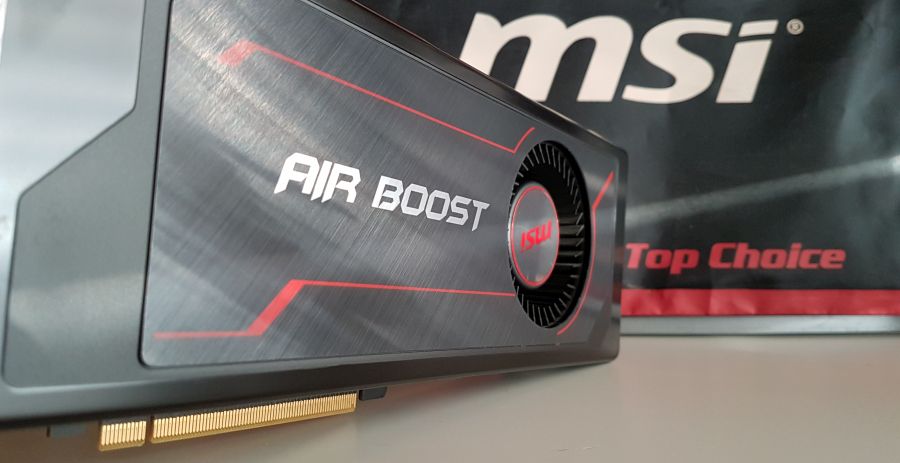
The RX Vega 56 AIR BOOST has a blower-based VGA cooler: The blower takes the cold air, pushes it through the card and hot air is ejected via big holes (this is the particularity of the Air Boost model) at the rear. That’s a blower cooler!
The homepage of MSI Radeon RX Vega 56 AIR BOOST can be found HERE.
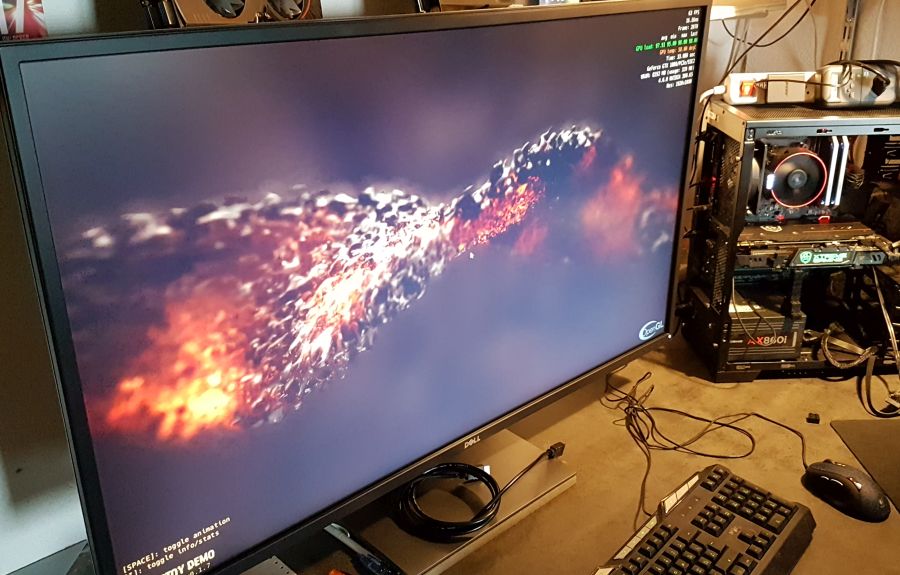
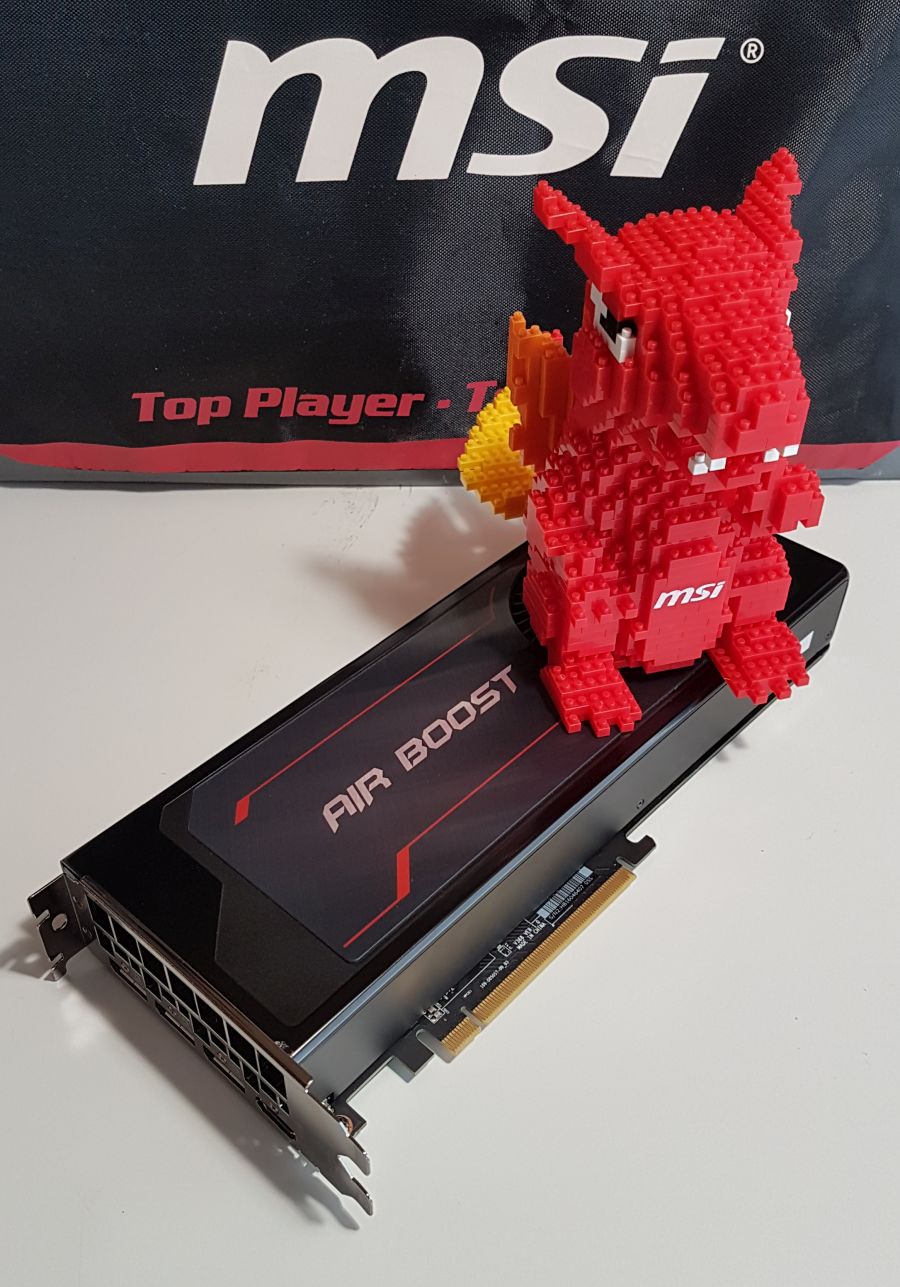
2 – Gallery
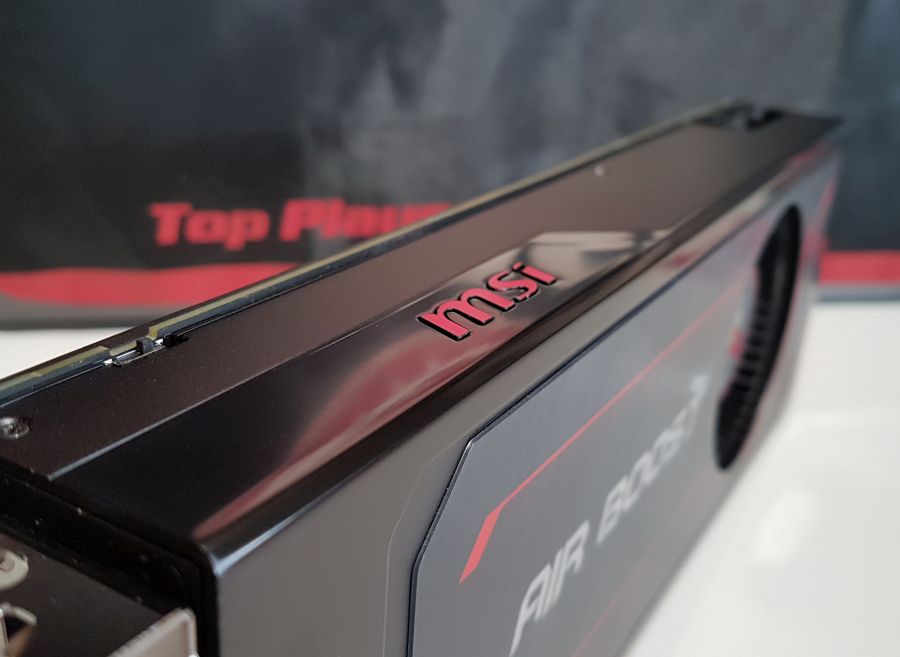
All photos have been taken with a Samsung Galaxy S7 mobile phone. I received the card without box so no pictures of the bundle.

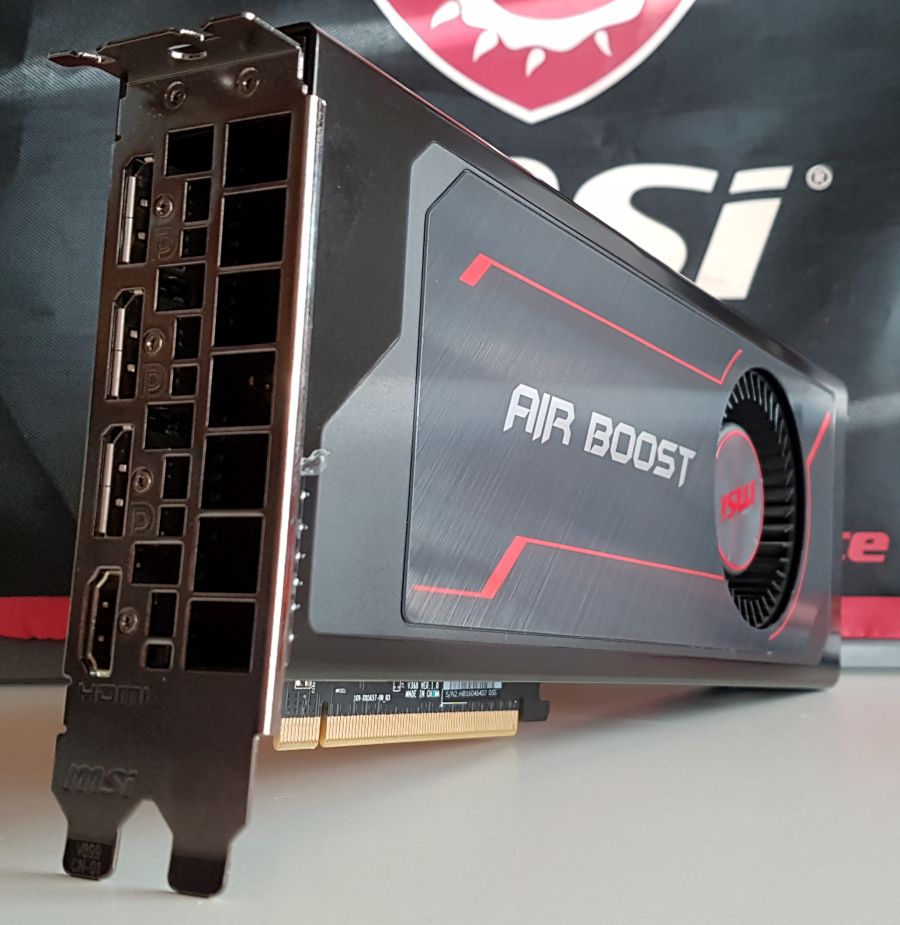
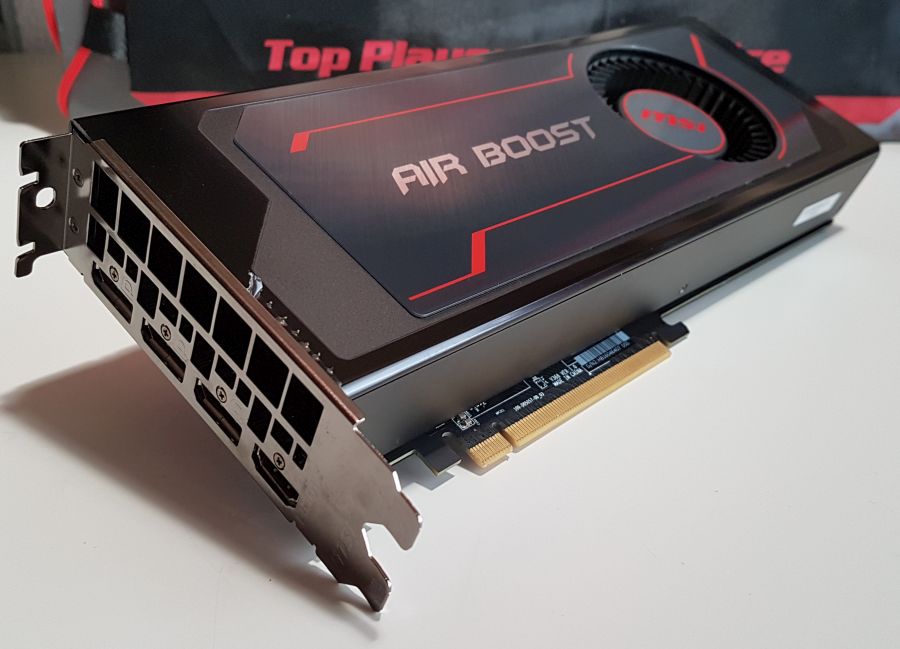
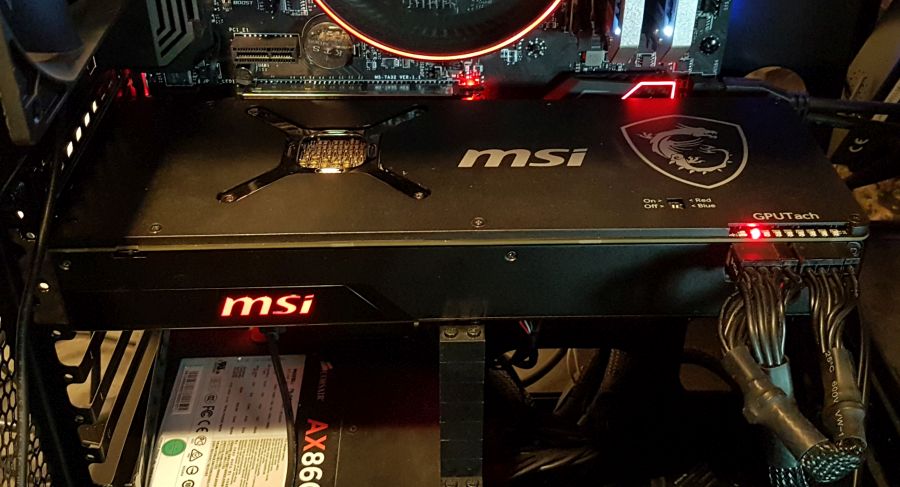
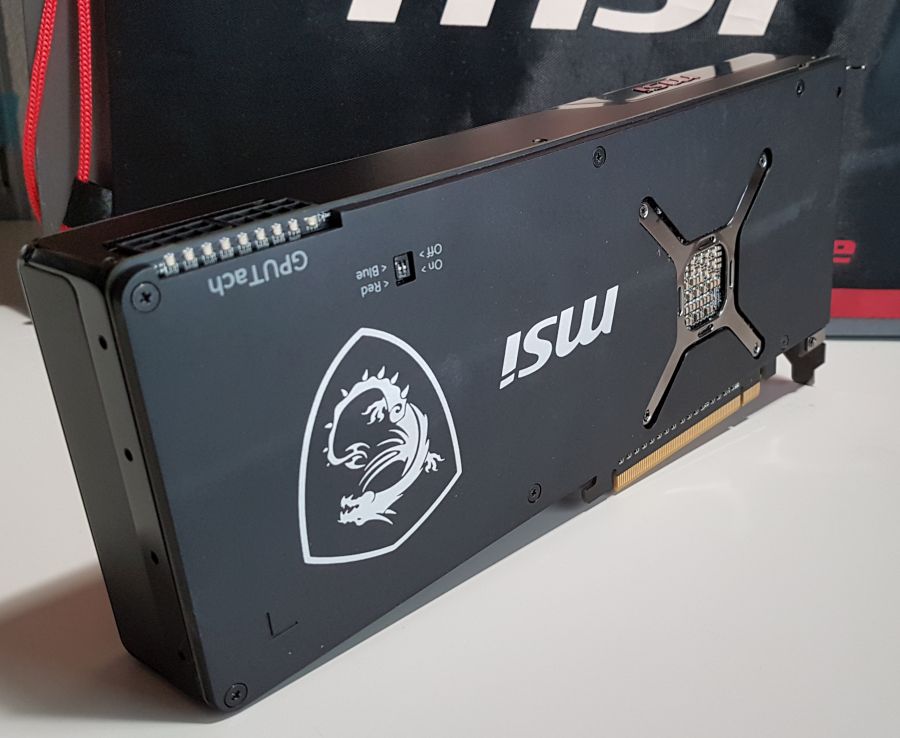
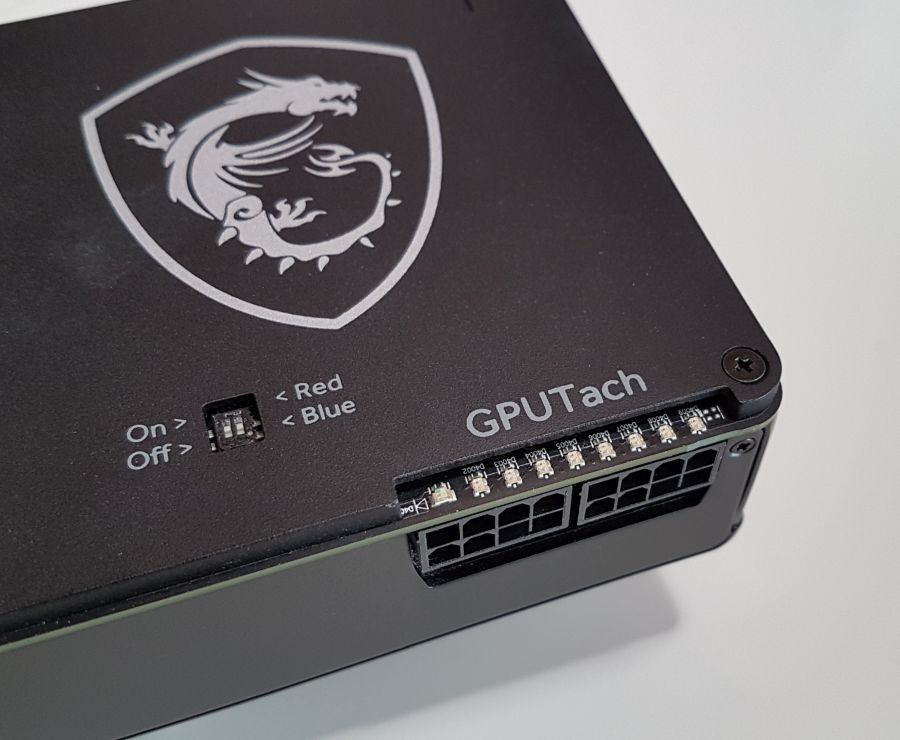
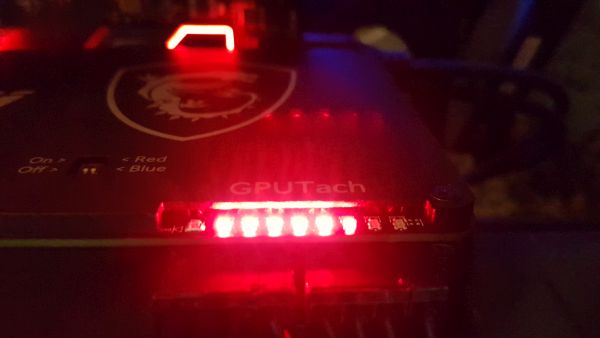
The RX Vega based graphics cards are available with a GPU tachometer (GPUTach): it’s a strip of 8 LEDs that shows the GPU usage. Two colors are available: blue and red. The GPUTach can be disabled as well.
3 – GPU Data

4 – GPU Benchmarks
Testbed configuration:
– CPU: AMD Ryzen 7 1700
– Motherboard: MSI X370 Gaming Pro Carbon
– Memory: 16GB DDR4 Corsair Dominator Platinum @ 3000MHz
– PSU: Corsair AX860i
– Software: Windows 10 64-bit + AMD Adrenalin 18.1.1
4.1 – 3DMark Sky Diver
| 36988 (graphics:59621, physics:14558, combined:24083) – GIGABYTE GeForce GTX 1080 XTREME GAMING – R390.65 |
| 36772 (graphics:58413, physics:14721, combined:24008) – MSI Radeon RX Vega 56 Air Boost – Adrenalin 18.1.1 |
| 36060 (graphics:56088, physics:14722, combined:23976) – EVGA GeForce GTX 1070 FTW – R390.65 |
| 30729 (graphics:41314, physics:14652, combined:24092) – EVGA GeForce GTX 1060 SC – R390.65 |
| 28286 (graphics:36014, physics:14640, combined:23354) – MSI Radeon RX 470 – Adrenalin 18.1.1 |
| 28779 (graphics:36846, physics:14720, combined:23798) – MSI Radeon R9 290X – Adrenalin 18.1.1 |
4.2 – 3DMark FireStrike (1920×1080)
| 15873 (graphics:22514, physics:16544, combined:4850) – GIGABYTE GeForce GTX 1080 XTREME GAMING – R390.65 |
| 13680 (graphics:18368, physics:16575, combined:4317) – EVGA GeForce GTX 1070 FTW – R390.65 |
| 13457 (graphics:18753, physics:16488, combined:3966) – MSI Radeon RX Vega 56 Air Boost – Adrenalin 18.1.1 |
| 11061 (graphics:12977, physics:16525, combined:4250) – EVGA GeForce GTX 1060 SC – R390.65 |
| 10785 (graphics:12647, physics:16416, combined:4119) – MSI Radeon RX 470 – Adrenalin 18.1.1 |
| 10706 (graphics:13178, physics:16344, combined:3662) – MSI Radeon R9 290X – Adrenalin 18.1.1 |
4.3 – 3DMark FireStrike Ultra (4K / 3840×2160)
| 5597 (graphics:5553, physics:16584, combined:2894) – GIGABYTE GeForce GTX 1080 XTREME GAMING – R390.65 |
| 4585 (graphics:4628, physics:16348, combined:2135) – MSI Radeon RX Vega 56 Air Boost – Adrenalin 18.1.1 |
| 4549 (graphics:4492, physics:16031, combined:2300) – EVGA GeForce GTX 1070 FTW – R390.65 |
| 3103 (graphics:3005, physics:16201, combined:1578) – EVGA GeForce GTX 1060 SC – R390.65 |
| 3001 (graphics:2962, physics:16353, combined:1413) – MSI Radeon R9 290X – Adrenalin 18.1.1 |
| 2861 (graphics:2837, physics:16443, combined:1316) – MSI Radeon RX 470 – Adrenalin 18.1.1 |
4.4 – Unigine Superposition – 1080p Medium – Direct3D
| 13872 (103.7 FPS) – GIGABYTE GeForce GTX 1080 XTREME GAMING – R390.65 |
| 12714 (95.10 FPS) – EVGA GeForce GTX 1070 FTW – R390.65 |
| 12002 (89.77 FPS) – MSI Radeon RX Vega 56 Air Boost – Adrenalin 18.1.1 |
| 9016 (67.4 FPS) – EVGA GeForce GTX 1060 SC – R390.65 |
| 8258 (61.7 FPS) – MSI Radeon R9 290X – Adrenalin 18.1.1 |
| 7102 (53.13 FPS) – MSI Radeon RX 470 – Adrenalin 18.1.1 |
4.4 – Unigine Superposition – 4K Optimized – Direct3D
| 7101 (53.1 FPS) – GIGABYTE GeForce GTX 1080 XTREME GAMING – R390.65 |
| 5580 (41.74 FPS) – EVGA GeForce GTX 1070 FTW – R390.65 |
| 5074 (37.95 FPS) – MSI Radeon RX Vega 56 Air Boost – Adrenalin 18.1.1 |
| 3854 (28.8 FPS) – EVGA GeForce GTX 1060 SC – R390.65 |
| 3010 (22.52 FPS) – MSI Radeon RX 470 – Adrenalin 18.1.1 |
4.5 – FurMark 1.20
P1080 (1920×1080)
| 7347 (122 FPS) – GIGABYTE GeForce GTX 1080 XTREME GAMING – R390.65 |
| 6666 (111 FPS) – MSI Radeon RX Vega 56 Air Boost – Adrenalin 18.1.1 |
| 6100 (102 FPS) – EVGA GeForce GTX 1070 FTW – R390.65 |
| 4887 (81 FPS) – MSI Radeon R9 290X – Adrenalin 18.1.1 |
| 4518 (75 FPS) – EVGA GeForce GTX 1060 SC – R390.65 |
| 3838 (64 FPS) – MSI Radeon RX 470 – Adrenalin 18.1.1 |
P2160 (3840×2160)
| 2779 (47 FPS) – GIGABYTE GeForce GTX 1080 XTREME GAMING – R390.65 |
| 2256 (38 FPS) – MSI Radeon RX Vega 56 Air Boost – Adrenalin 18.1.1 |
| 2206 (37 FPS) – EVGA GeForce GTX 1070 FTW – R390.65 |
| 1607 (27 FPS) – MSI Radeon R9 290X – Adrenalin 18.1.1 |
| 1556 (26 FPS) – EVGA GeForce GTX 1060 SC – R390.65 |
| 1330 (22 FPS) – MSI Radeon RX 470 – Adrenalin 18.1.1 |
4.6 – Rhodium LC
Rhodium LC (LC for Liquid Carbon!) is a new GPU pixel shader benchmark made with GeeXLab and based on this shadertoy demo. You can download RhodiumLC from THIS PAGE.
P1080 (1920×1080)
| 3747 (62 FPS) – GIGABYTE GeForce GTX 1080 XTREME GAMING – R390.65 |
| 2860 (47 FPS) – EVGA GeForce GTX 1070 FTW – R390.65 |
| 2606 (43 FPS) – MSI Radeon RX Vega 56 Air Boost – Adrenalin 18.1.1 |
| 1931 (32 FPS) – EVGA GeForce GTX 1060 SC – R390.65 |
| 1414 (23 FPS) – MSI Radeon R9 290X – Adrenalin 18.1.1 |
| 1187 (19 FPS) – MSI Radeon RX 470 – Adrenalin 18.1.1 |
P2160 (3840×2160)
| 962 (16 FPS) – GIGABYTE GeForce GTX 1080 XTREME GAMING – R390.65 |
| 736 (12 FPS) – EVGA GeForce GTX 1070 FTW – R390.65 |
| 663 (11 FPS) – MSI Radeon RX Vega 56 Air Boost – Adrenalin 18.1.1 |
| 497 (8 FPS) – EVGA GeForce GTX 1060 SC – R390.65 |
| 325 (5 FPS) – MSI Radeon R9 290X – Adrenalin 18.1.1 |
| 303 (5 FPS) – MSI Radeon RX 470 – Adrenalin 18.1.1 |
4.7 – MSI Kombustor 2017 – TessMark X32 OpenGL
MSI Kombustor 2017 (v0.6.2.0) is the new version of MSI Kombustor. For this test, I used TessMark X32 which is an OpenGL 4.0 tessellation benchmark with a tessellation level of 32. You can download MSI Kombustor 2017 from THIS PAGE.
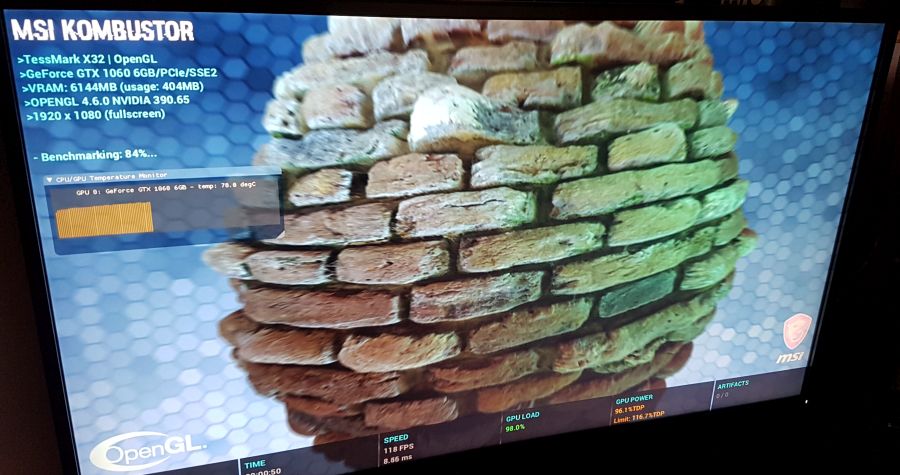
P1080 (1920×1080)
| 13657 (227 FPS) – GIGABYTE GeForce GTX 1080 XTREME GAMING – R390.65 |
| 10578 (176 FPS) – EVGA GeForce GTX 1070 FTW – R390.65 |
| 7832 (130 FPS) – MSI Radeon RX Vega 56 Air Boost – Adrenalin 18.1.1 |
| 7100 (118 FPS) – EVGA GeForce GTX 1060 SC – R390.65 |
| 6016 (100 FPS) – MSI Radeon RX 470 – Adrenalin 18.1.1 |
| 1910 (32 FPS) – MSI Radeon R9 290X – Adrenalin 18.1.1 |
5 – Burn-in Test

This burn-in test has been done with FurMark 1.20.
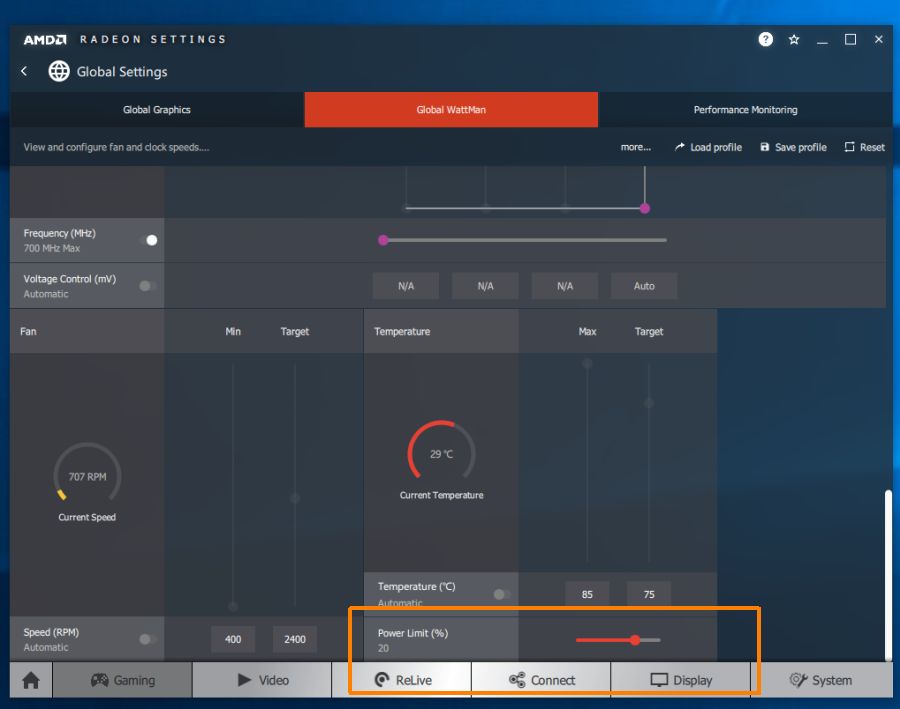
As usual, the first thing to do befor running a stress test is to set to the max the power target limit. I used AMD WattMan for this job. The RX Vega 56 Air Boost has a max power limit of 150% TDP (value read in GPU Shark) which is very nice. So I set the power limit to 150% TDP. If you don’t set the power limit to the max, the GPU is throttled too much when FurMark is running. I also did a test with default power limit (100%TDP).
Here is how to set the power limit with Adrenalin + WattMan (here the power limit is set to 120% TDP):
Idle state
– total power consumption: 55W
– GPU temperature: 28°C
Load state – 100% TDP
– total power consumption: 275W
– GPU temperature: 73°C
– GPU core clock: 1120MHz
Load state – 150% TDP
– total power consumption: 385W
– GPU temperature: 78°C
– GPU core clock: 1294MHz
A rough estimation of the power consumption of the RX Vega 56 is:
P = (385-55-20) * 0.9
P = 280W
where 0.9 is the efficiency factor of the Corsair AX 860i PSU and 20 is an estimation of the additional CPU load when FurMark is running.
Even with the power limit set to 150% TDP, the GPU does not run at boost clock speed under FurMark: 1294MHz while official boost clock is 1520MHz.
At idle state, the GPU temperature is low (28°C) and the blower cooler is quiet. In load, it’s another story: the temperature can reach 78°C and to correctly cool to GPU, the blower is getting noisy: around 52dB measured at 30cm.
Thermal imaging
idle state
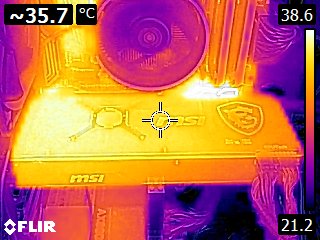
load state

6 – Conclusion
The Radeon RX Vega 56 is a solid alternative to NVIDIA GeForce GTX 1070. Both GPUs are neck and neck: depending on the test, the RX Vega 56 is faster or slower than the GTX 1070.
The RX Vega 56 has a TDP of 210W but with two 8-pin power connectors, the Radeon RX Vega 56 can draw up to 375W. I set the power limit to 150% TDP (the max!) and the card has flawlessly passed all burn-in tests with a power draw close to 300W. The blower cooler is a bit noisy in load but does its job correctly. At idle, the card is quiet. The card has a backplate and the GPU tachometer (or GPUTach) is a nice gadget!
The only issue with Radeon RX Vega cards is that… they are not available! This MSI RX Vega 56 is the first RX Vega graphics card I can play with. It was time!
Amazing card for 1440p gaming but how to buy it in this era of cryptocurrency mining?